

Metrics System
![]()

- Metrics Sink Configuration
- Metric Types
- Master Web UI Metrics
- Grafana Web UI with Prometheus
- References
Metrics provide insight into what is going on in the cluster. They are an invaluable resource for monitoring and debugging. Alluxio has a configurable metrics system based on the Coda Hale Metrics Library. In the metrics system, sources generate metrics, and sinks consume these metrics. The metrics system polls sources periodically and passes metric records to sinks.
Alluxio’s metrics are partitioned into different instances corresponding to Alluxio components. Within each instance, users can configure a set of sinks to which metrics are reported. The following instances are currently supported:
- Master: The Alluxio master process.
- Worker: The Alluxio worker process.
- Client: Any process with the Alluxio client library.
Metrics Sink Configuration
A sink specifies where metrics are delivered to. Each instance can report to zero or more sinks.
ConsoleSink: Outputs metrics values to the console.CsvSink: Exports metrics data to CSV files at regular intervals.JmxSink: Registers metrics for viewing in a JMX console.GraphiteSink: Sends metrics to a Graphite server.MetricsServlet: Adds a servlet in Web UI to serve metrics data as JSON data.PrometheusMetricsServlet: Adds a servlet in Web UI to serve metrics data in Prometheus format
The metrics system is configured via a configuration file that Alluxio expects to be present at $ALLUXIO_HOME/conf/metrics.properties.
A custom file location can be specified via the alluxio.metrics.conf.file configuration property.
Alluxio provides a metrics.properties.template under the conf directory which includes all configurable properties
and guidance on how to specify each property.
Default HTTP JSON Sink
By default, MetricsServlet is enabled in Alluxio leading master and workers.
You can send an HTTP request to /metrics/json/ of the Alluxio leading master to get a snapshot of all metrics in JSON format.
Metrics on the Alluxio leading master contains its instance metrics and a summary of the cluster-wide aggregated metrics.
# Get the metrics in JSON format from Alluxio leading master
$ curl <LEADING_MASTER_HOSTNAME>:<MASTER_WEB_PORT>/metrics/json

# For example, get the metrics from master process running locally with default web port
$ curl 127.0.0.1:19999/metrics/json/
Send an HTTP request to /metrics/json/ of the active Alluxio workers to get per-worker metrics.
# Get the metrics in JSON format from an active Alluxio worker
$ curl <WORKER_HOSTNAME>:<WORKER_WEB_PORT>/metrics/json

# For example, get the metrics from worker process running locally with default web port
$ curl 127.0.0.1:30000/metrics/json/
CSV Sink Setup
This section gives an example of writing collected metrics to CSV files.
First, create the polling directory for CsvSink (if it does not already exist):
$ mkdir /tmp/alluxio-metrics
In the metrics property file, $ALLUXIO_HOME/conf/metrics.properties by default, add the following properties:
# Enable CsvSink
sink.csv.class=alluxio.metrics.sink.CsvSink

# Polling period for CsvSink
sink.csv.period=1
sink.csv.unit=seconds

# Polling directory for CsvSink, ensure this directory exists!
sink.csv.directory=/tmp/alluxio-metrics
If Alluxio is deployed in a cluster, this file needs to be distributed to all the nodes. Restart the Alluxio servers to activate the new configuration changes.
After starting Alluxio, the CSV files containing metrics will be found in the sink.csv.directory.
The filename will correspond with the metric name.
Refer to metrics.properties.template for all possible sink specific configurations.
Prometheus Sink Setup
Prometheus is a monitoring tool that can help to monitor Alluxio metrics changes.
In the metrics property file, $ALLUXIO_HOME/conf/metrics.properties by default, add the following properties:
# Enable PrometheusMetricsServlet
sink.prometheus.class=alluxio.metrics.sink.PrometheusMetricsServlet
If Alluxio is deployed in a cluster, this file needs to be distributed to all the nodes. Restart the Alluxio servers to activate new configuration changes.
You can send an HTTP request to /metrics/prometheus/ of the Alluxio leading master or workers to get a snapshot of metrics in Prometheus format.
# Get the metrics in JSON format from Alluxio leading master or workers
$ curl <LEADING_MASTER_HOSTNAME>:<MASTER_WEB_PORT>/metrics/prometheus/
$ curl <WORKER_HOSTNAME>:<WORKER_WEB_PORT>/metrics/prometheus/

# For example, get the local master metrics with its default web port 19999
$ curl 127.0.0.1:19999/metrics/prometheus/
# Get the local worker metrics with its default web port 30000
$ curl 127.0.0.1:30000/metrics/prometheus/
Then configure prometheus.yml pointing to those endpoints to get Alluxio metrics.
scrape_configs:
  - job_name: "alluxio master"
      metrics_path: '/metrics/prometheus/'
      static_configs:
      - targets: ['<LEADING_MASTER_HOSTNAME>:<MASTER_WEB_PORT>' ]
  - job_name: "alluxio worker"
      metrics_path: '/metrics/prometheus/'
      static_configs:
      - targets: ['<WORKER_HOSTNAME>:<WORKER_WEB_PORT>' ]
Metric Types
Each metric falls into one of the following metric types:
- Gauge: Records a value
- Meter: Measures the rate of events over time (e.g., “requests per minute”)
- Counter: Measures the number of times an event occurs
- Timer: Measures both the rate that a particular event is called and the distribution of its duration
For more details about the metric types, please refer to the metrics library documentation
Master Web UI Metrics
Besides the raw metrics shown via metrics servlet or custom metrics configuration,
users can track key cluster performance metrics in a more human-readable way in the web interface of
Alluxio leading master (http://<leading_master_host>:19999/metrics).
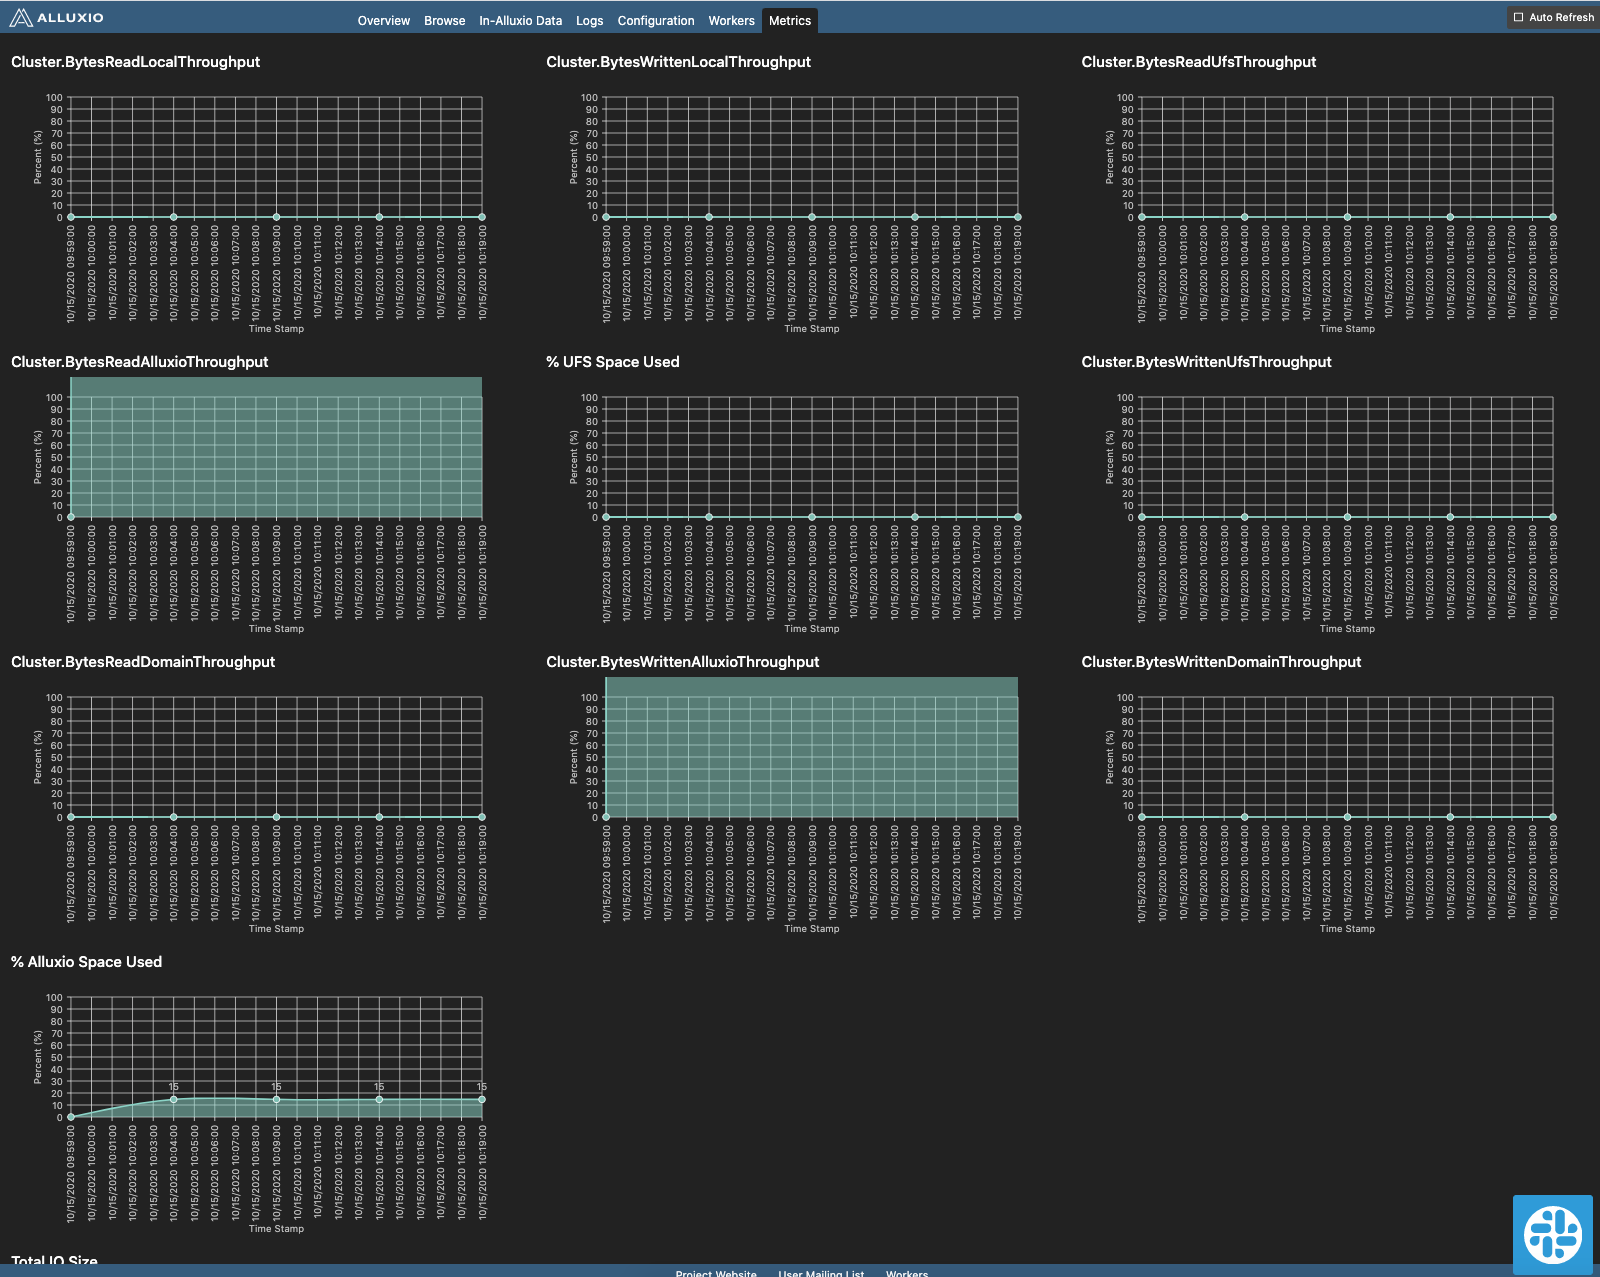
The web page includes the following information:
- Timeseries for Alluxio space and root UFS space percentage usage information
- Timeseries for aggregated cluster throughput which is essential for determining the effectiveness of the Alluxio cache
- Cumulative RPC invocations and operations performed by the Alluxio cluster
- Cumulative API calls served per mount point that can serve as a strong metric for quantifying the latency and potential cost savings provided by Alluxio’s namespace virtualization
The nickname and original metric name corresponding are shown:
| Nick Name | Original Metric Name |
|---|---|
| Local Alluxio (Domain Socket) Read | cluster.BytesReadDomain |
| Local Alluxio (Domain Socket) Write | cluster.BytesWrittenDomain |
| Local Alluxio (Short-circuit) Read | cluster.BytesReadLocal |
| Local Alluxio (Short-circuit) Write | cluster.BytesWrittenLocal |
| Remote Alluxio Read | cluster.BytesReadRemote |
| Remote Alluxio Write | cluster.BytesWrittenRemote |
| Under Filesystem Read | cluster.BytesReadUfsAll |
| Under Filesystem Write | cluster.BytesWrittenUfsAll |
Detailed descriptions of those metrics are in cluster metrics.
Mounted Under FileSystem Read shows the cluster.BytesReadPerUfs.UFS:<UFS_ADDRESS> of each Alluxio UFS.
Mounted Under FileSystem Write shows the cluster.BytesWrittenPerUfs.UFS:<UFS_ADDRESS> of each Alluxio UFS.
Logical Operations and RPC Invocations present parts of the master metrics.
Saved Under FileSystem Operations shows the operations fulfilled by Alluxio’s namespace directly
without accessing UFSes. Performance improvement can be significant if the target UFS is remote or slow in response.
Costs can be saved if the underlying storage charges are based on requests.
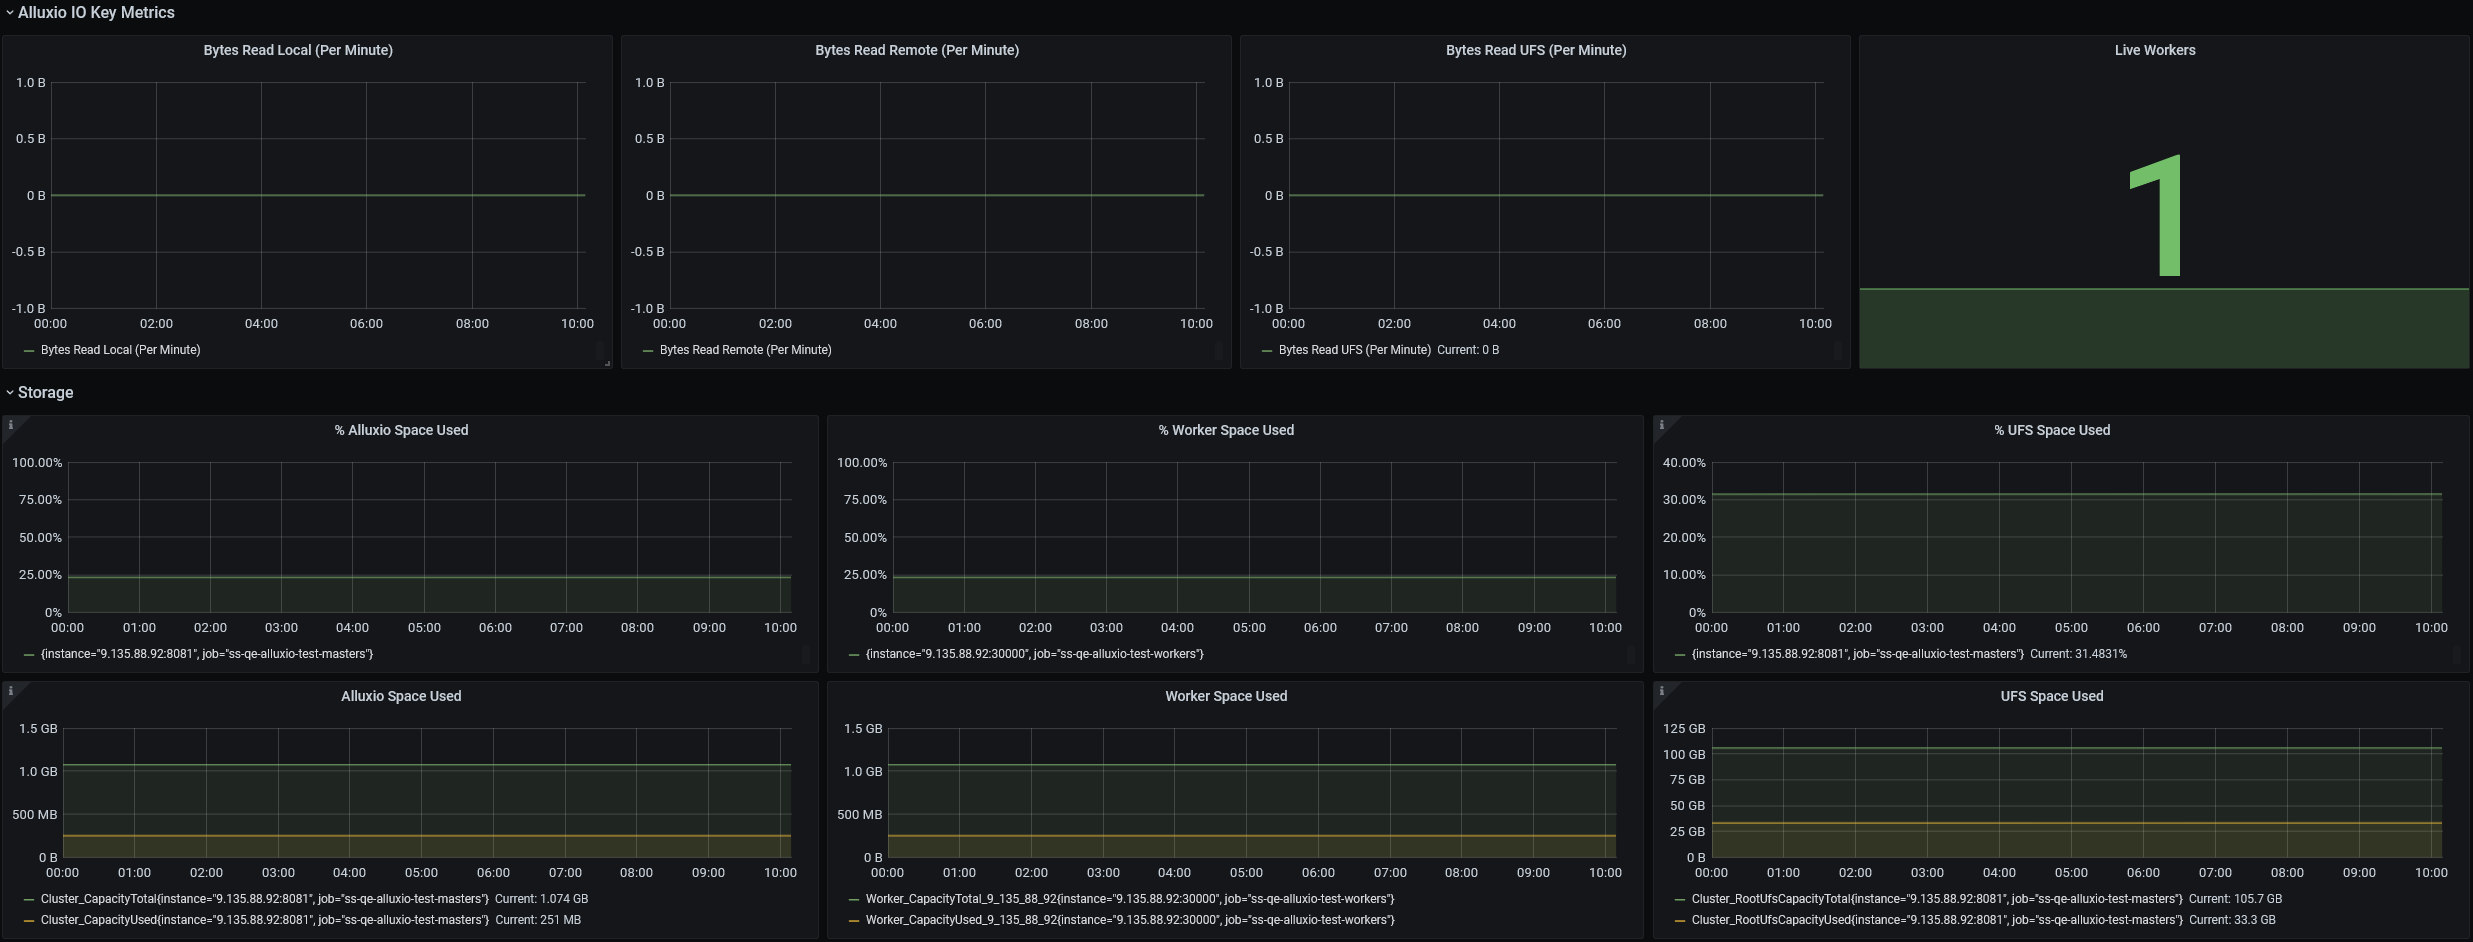
Grafana Web UI with Prometheus
Grafana is a metrics analytics and visualization software used for visualizing time series data. You can use Grafana to better visualize the various metrics that Alluxio collects. The software allows users to more easily see changes in memory, storage, and completed operations in Alluxio.
Grafana supports visualizing data from Prometheus. The following steps can help you to build your Alluxio monitoring based on Grafana and Prometheus easily.
- Install Grafana using the instructions here.
- Download the Grafana template JSON file for Alluxio.
- Import the template JSON file to create a dashboard. See this example for importing a dashboard.
- Add the Prometheus data source to Grafana with a custom name, for example, prometheus-alluxio. Refer to the toturial for help on importing a dashboard.
-
Modify the variables in the dashboard/settings with instructions here and save your dashboard.
Variable Value alluxio_datasource Your prometheus datasource name (eg. prometheus-alluxio used in step 4) masters Master ‘job_name’ configured in prometheus.yml(eg. alluxio master)workers Worker ‘job_name’ configured in prometheus.yml(eg. alluxio worker)alluxio_user The user used to start up Alluxio (eg. alluxio)
If your Grafana dashboard appears like the screenshot below, you have built your monitoring successfully. Of course, you can modify the JSON file or just operate on the dashboard to design your monitoring.
References
Detailed Alluxio metrics are listed in the metrics list doc. Metrics stored in leading master is exposed via fsadmin report metrics.