Web User Interface
Alluxio has a user-friendly web interface allowing users to monitor and manage the cluster. The master and workers all serve their own web UI. The default port for the web interface is 19999 and 30000 for masters and workers respectively.
Alluxio Master Web Interface
The Alluxio master web interface can be found by visiting http://<MASTER IP>:19999.
For instance, if Alluxio was started locally, the master web interface
can be viewed by visiting localhost:19999.
The Alluxio master web interface contains several different pages, described below.
Home Page
The Alluxio master home page looks something like below:
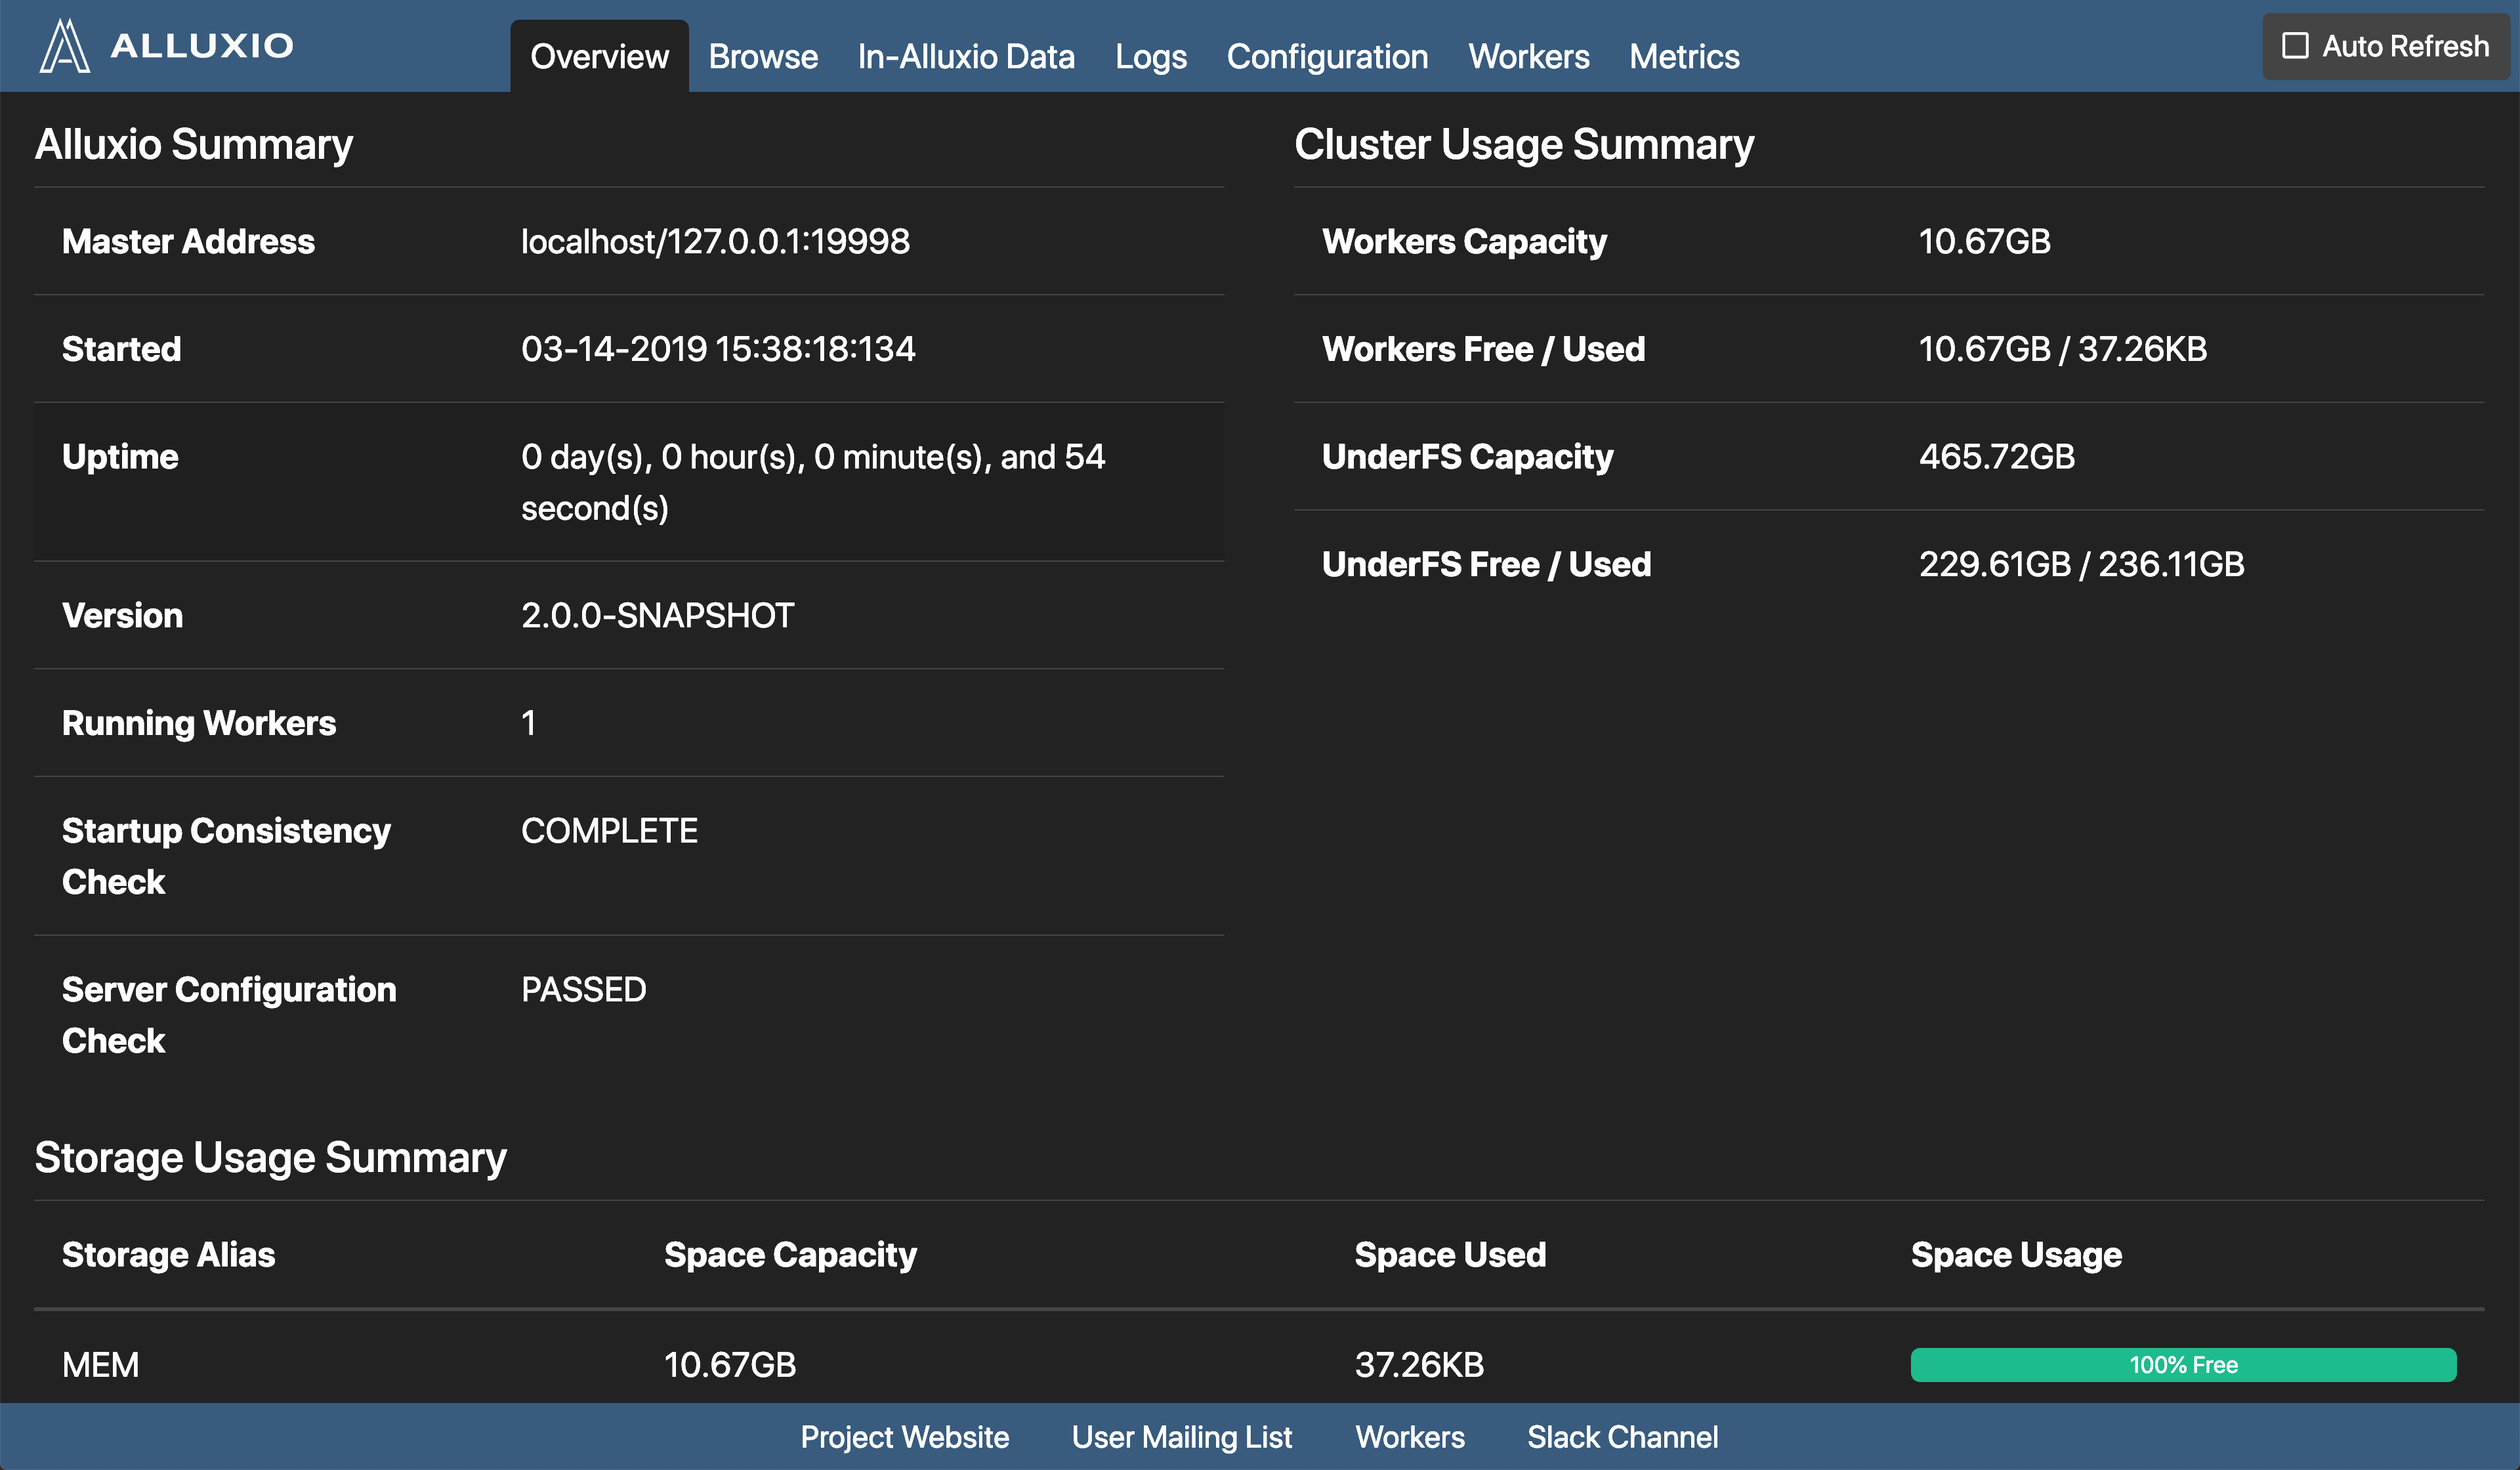
The home page gives an overview of the system status. It includes the following sections:
-
Alluxio Summary Alluxio system level information
-
Cluster Usage Summary Alluxio storage information as well as under storage information. Alluxio storage utilization can be near 100%, but under storage utilization should not approach 100%.
-
Storage Usage Summary Alluxio tiered storage information, which gives a breakdown of the amount of space used per tier across the cluster.
Configuration Page
To check the current configuration information, click “Configuration” in the navigation bar on the top of the screen.
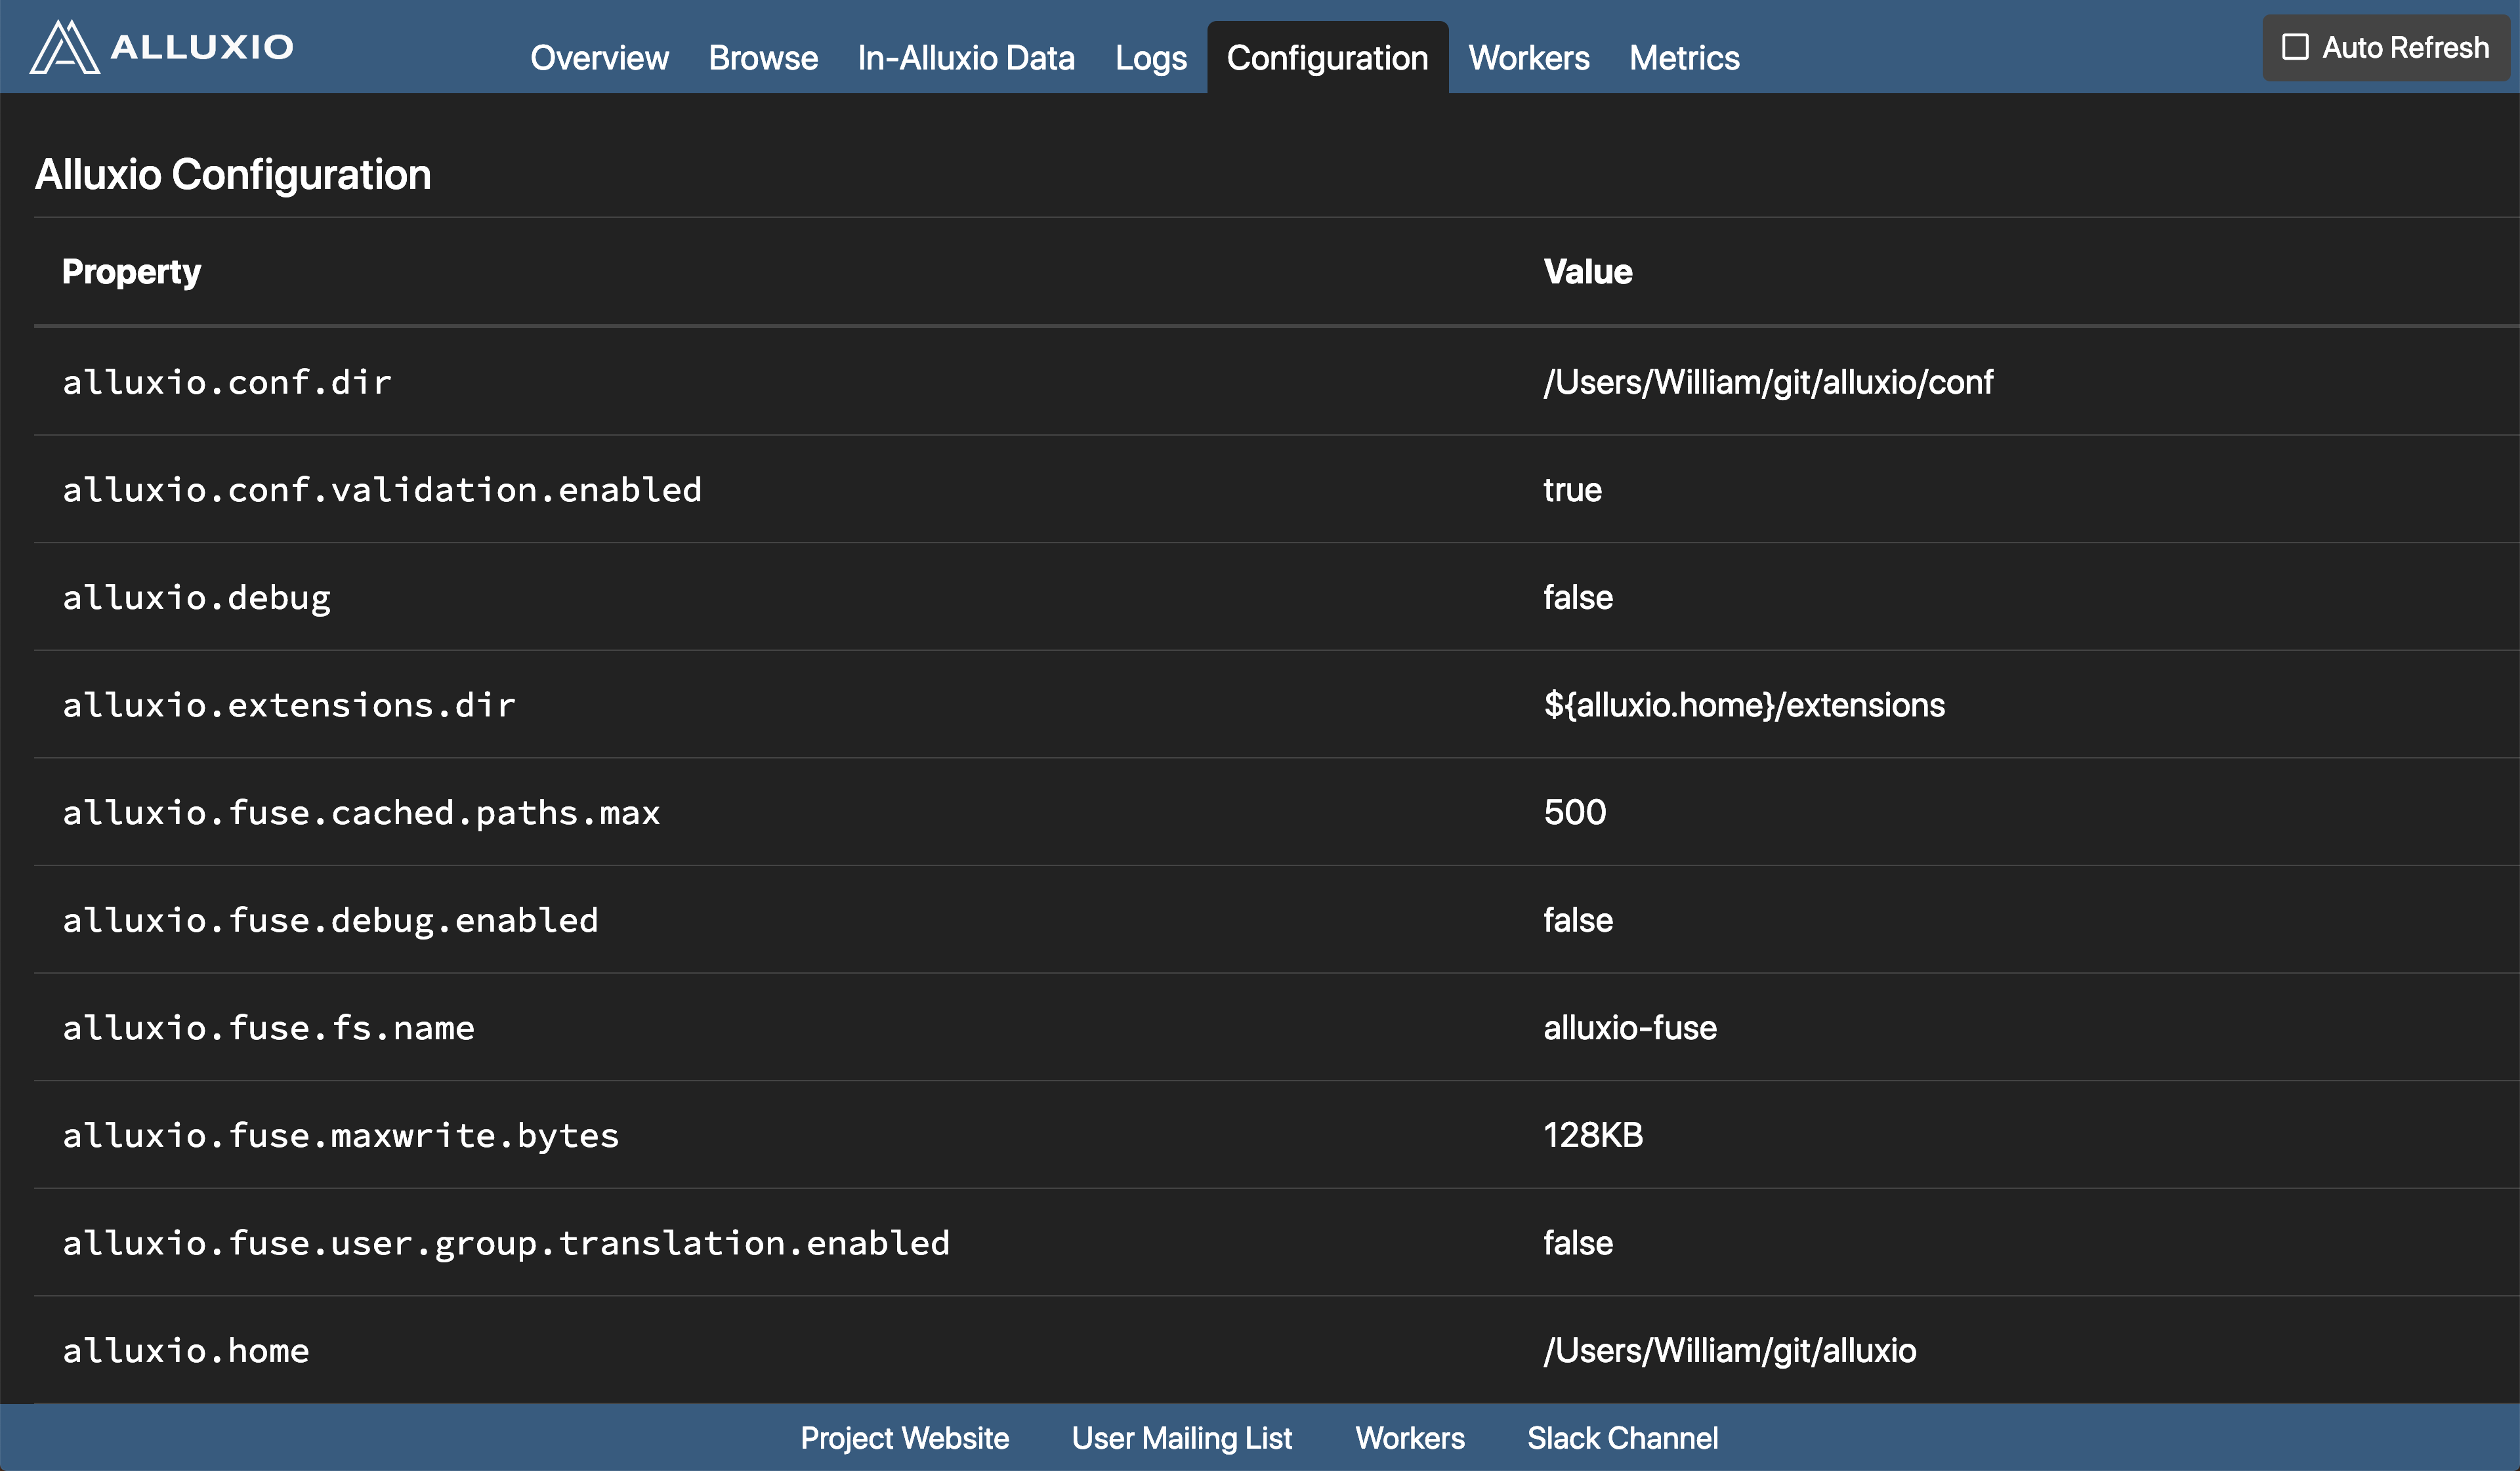
The configuration page has two sections:
-
Alluxio Configuration A map of all the Alluxio configuration properties and their values.
-
White List Contains all the Alluxio path prefixes eligible to be stored in Alluxio. A request may be made to a file not prefixed by a path in the white list. Only whitelisted files will be stored in Alluxio.
Browse File System
To browse the Alluxio file system through the UI. select the “Browse” tab in the navigation bar:
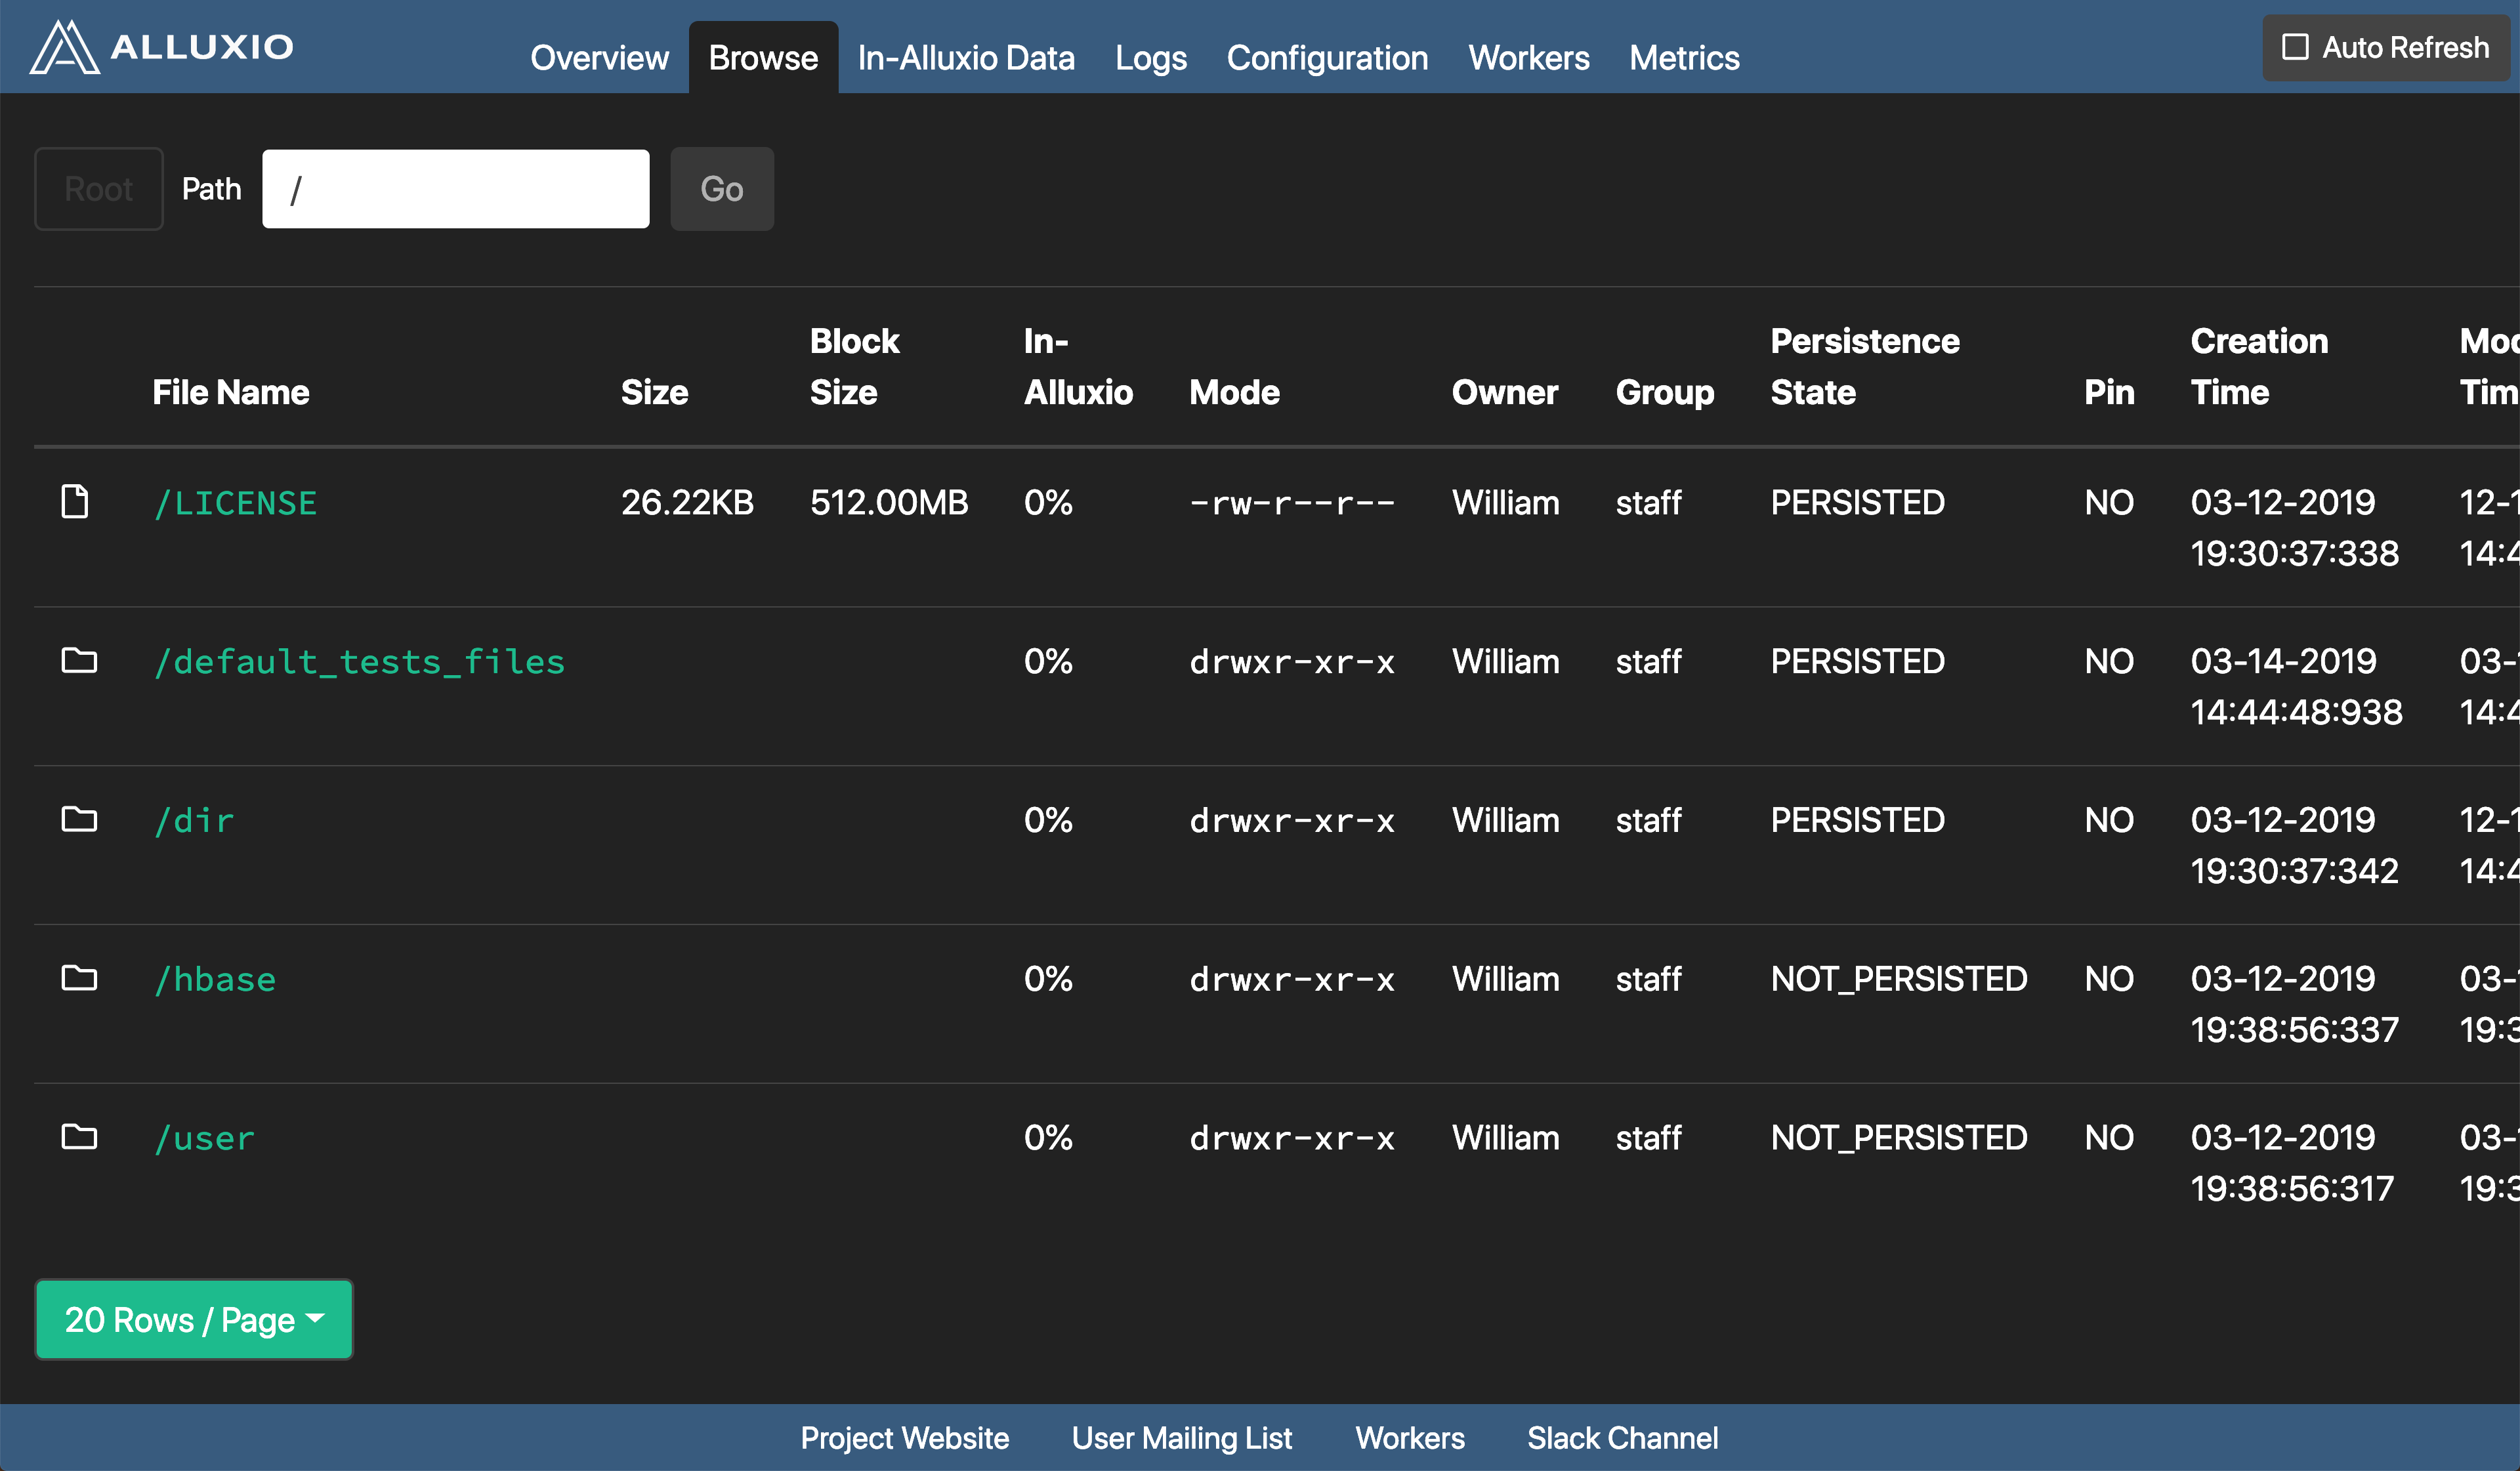
Files in the current folder are listed, with the file name, file size, size for each block, the
percentage of in-Alluxio data, creation time, and the modification time.
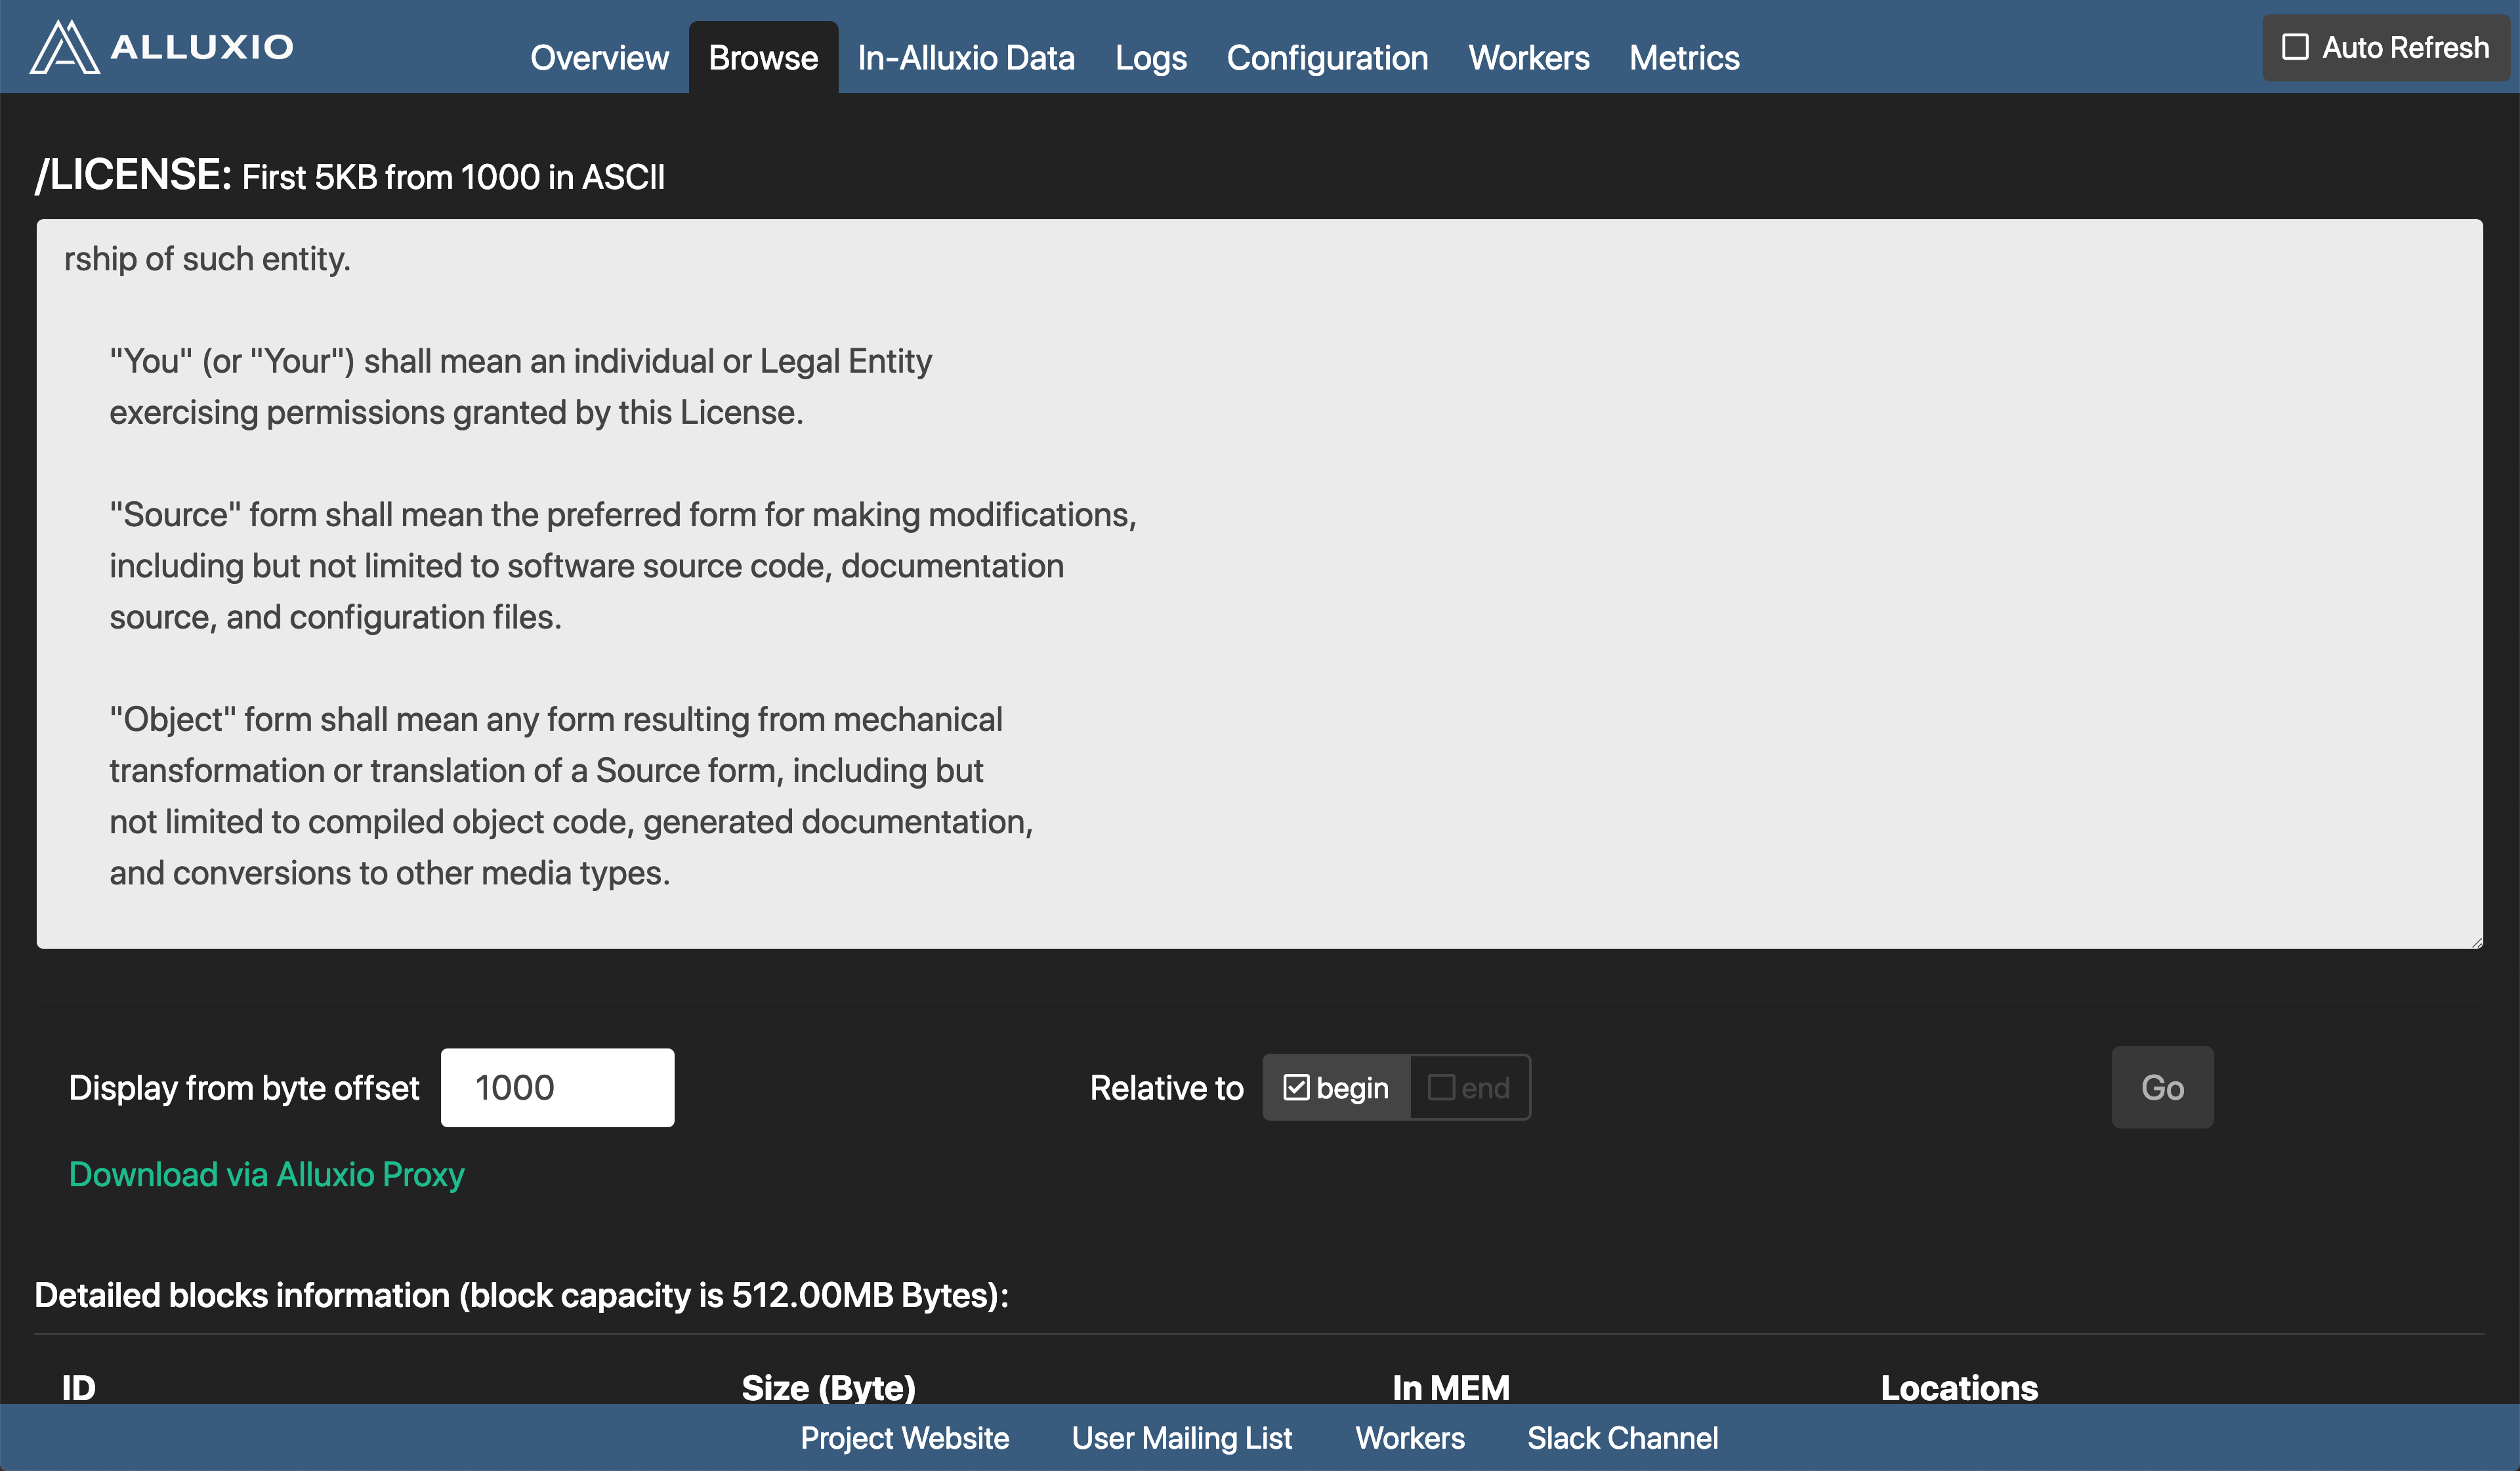
To view the content of a file, click the link for that file.
Browse In-Alluxio Files Page
To browse all in-Alluxio files, click on the “In-Alluxio Files” tab in the navigation bar.
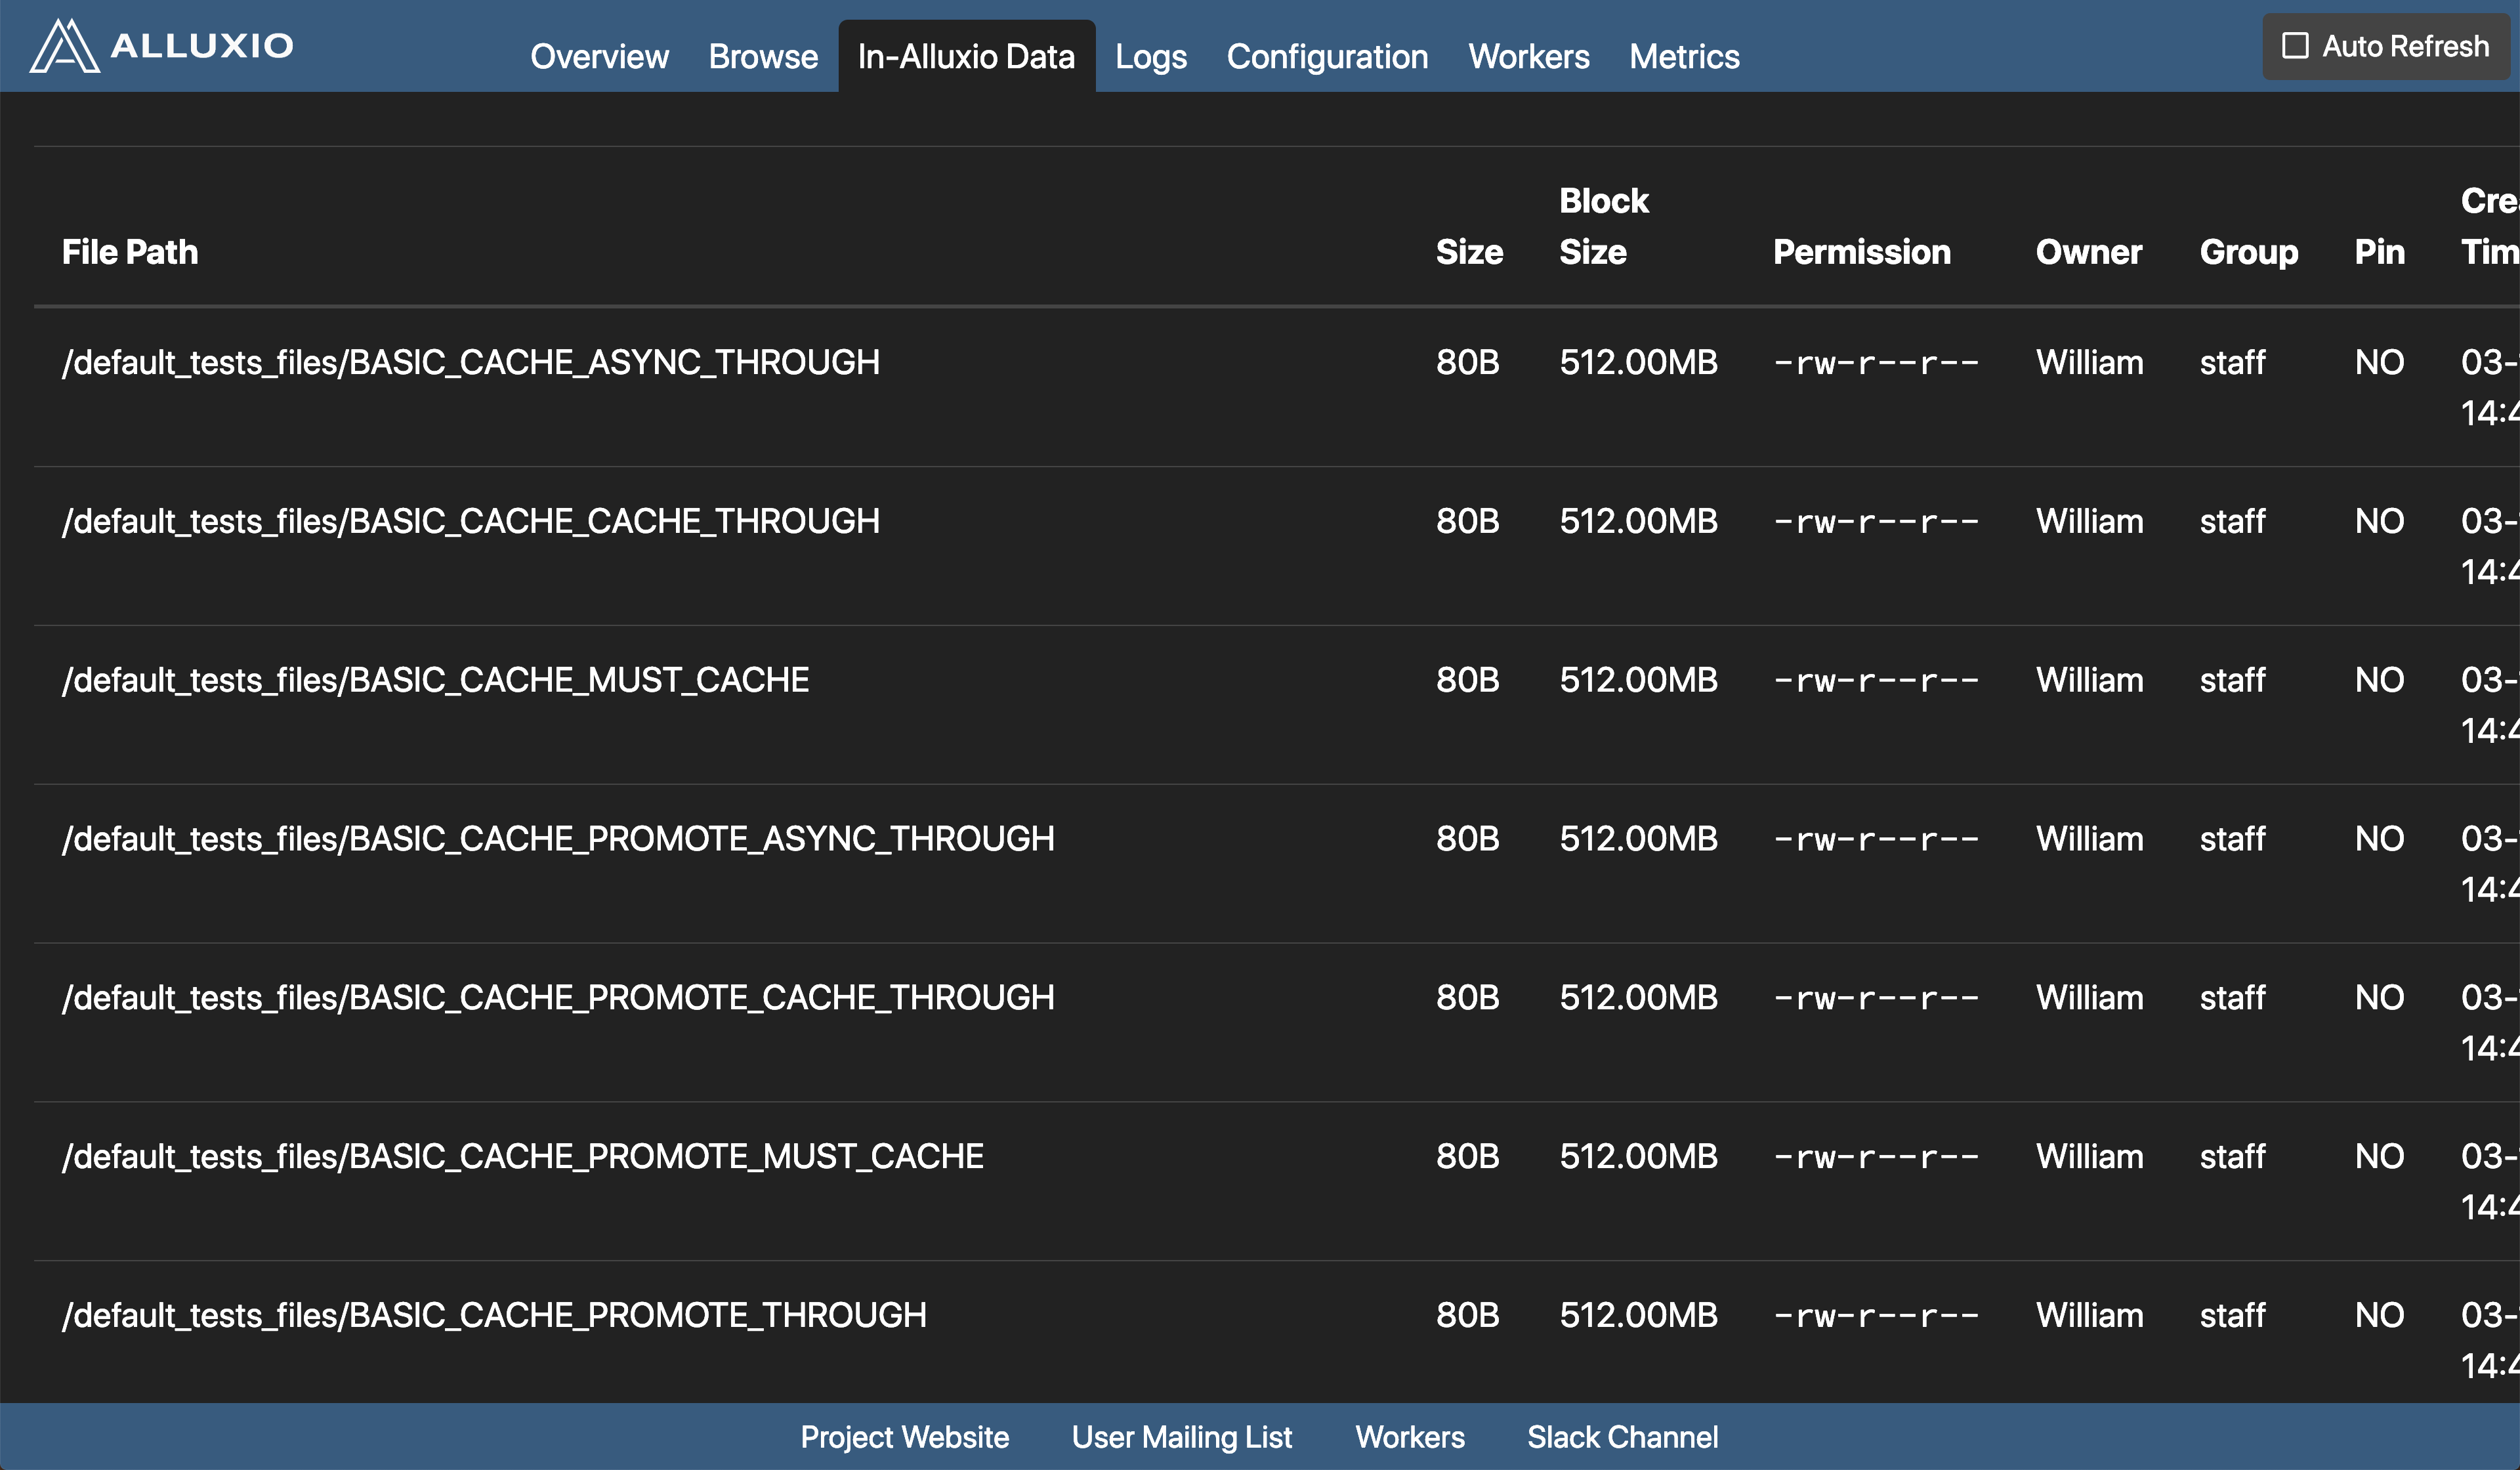
Files currently in Alluxio are listed, with the file name, file size, size for each block, whether the file is pinned or not, the file creation time, and the file modification time.
Workers Page
The master UI shows all known Alluxio workers in the system in the “Workers” tab.
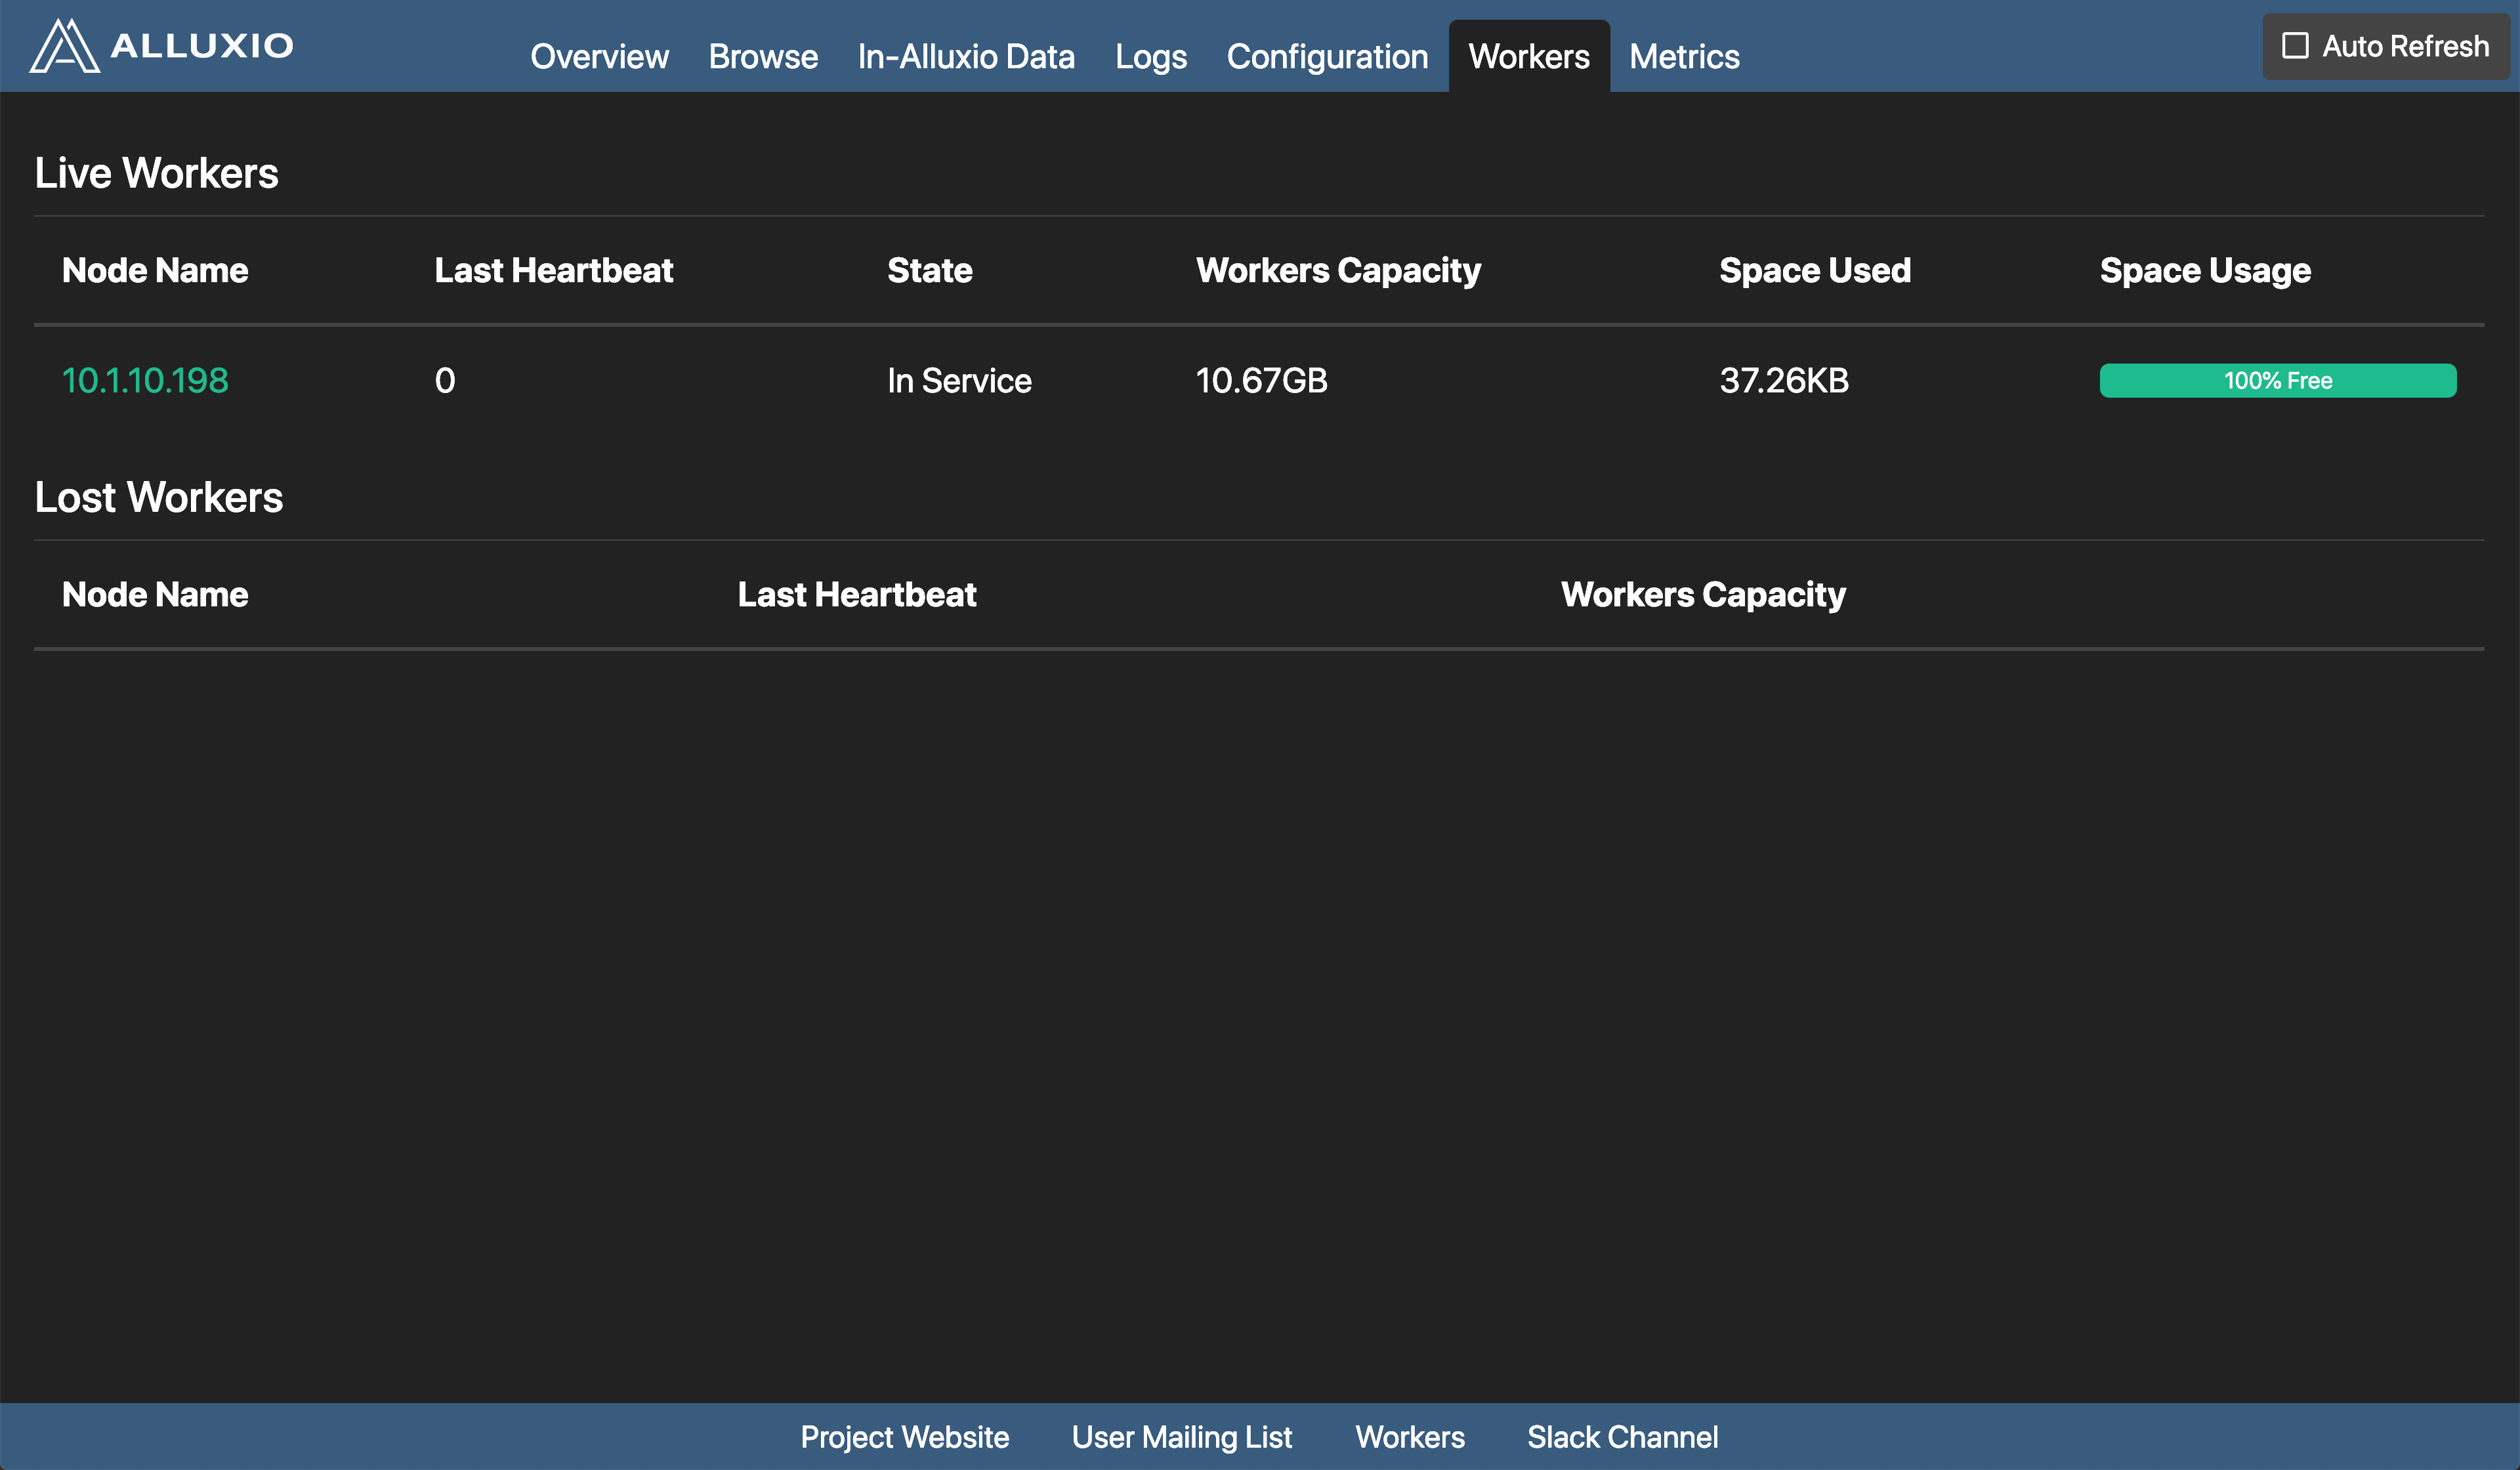
The workers page gives an overview of all Alluxio worker nodes divided into two sections:
-
Live Workers A list of all the workers currently serving Alluxio requests. Clicking on the worker name will redirect to the worker’s web UI.
-
Lost Workers A list of all workers proclaimed as dead by the master, usually due to a long timeout waiting for the worker heartbeat. Possible causes include system restart or network failures.
Master Metrics
To access master metrics section, click on the “Metrics” tab in the navigation bar.
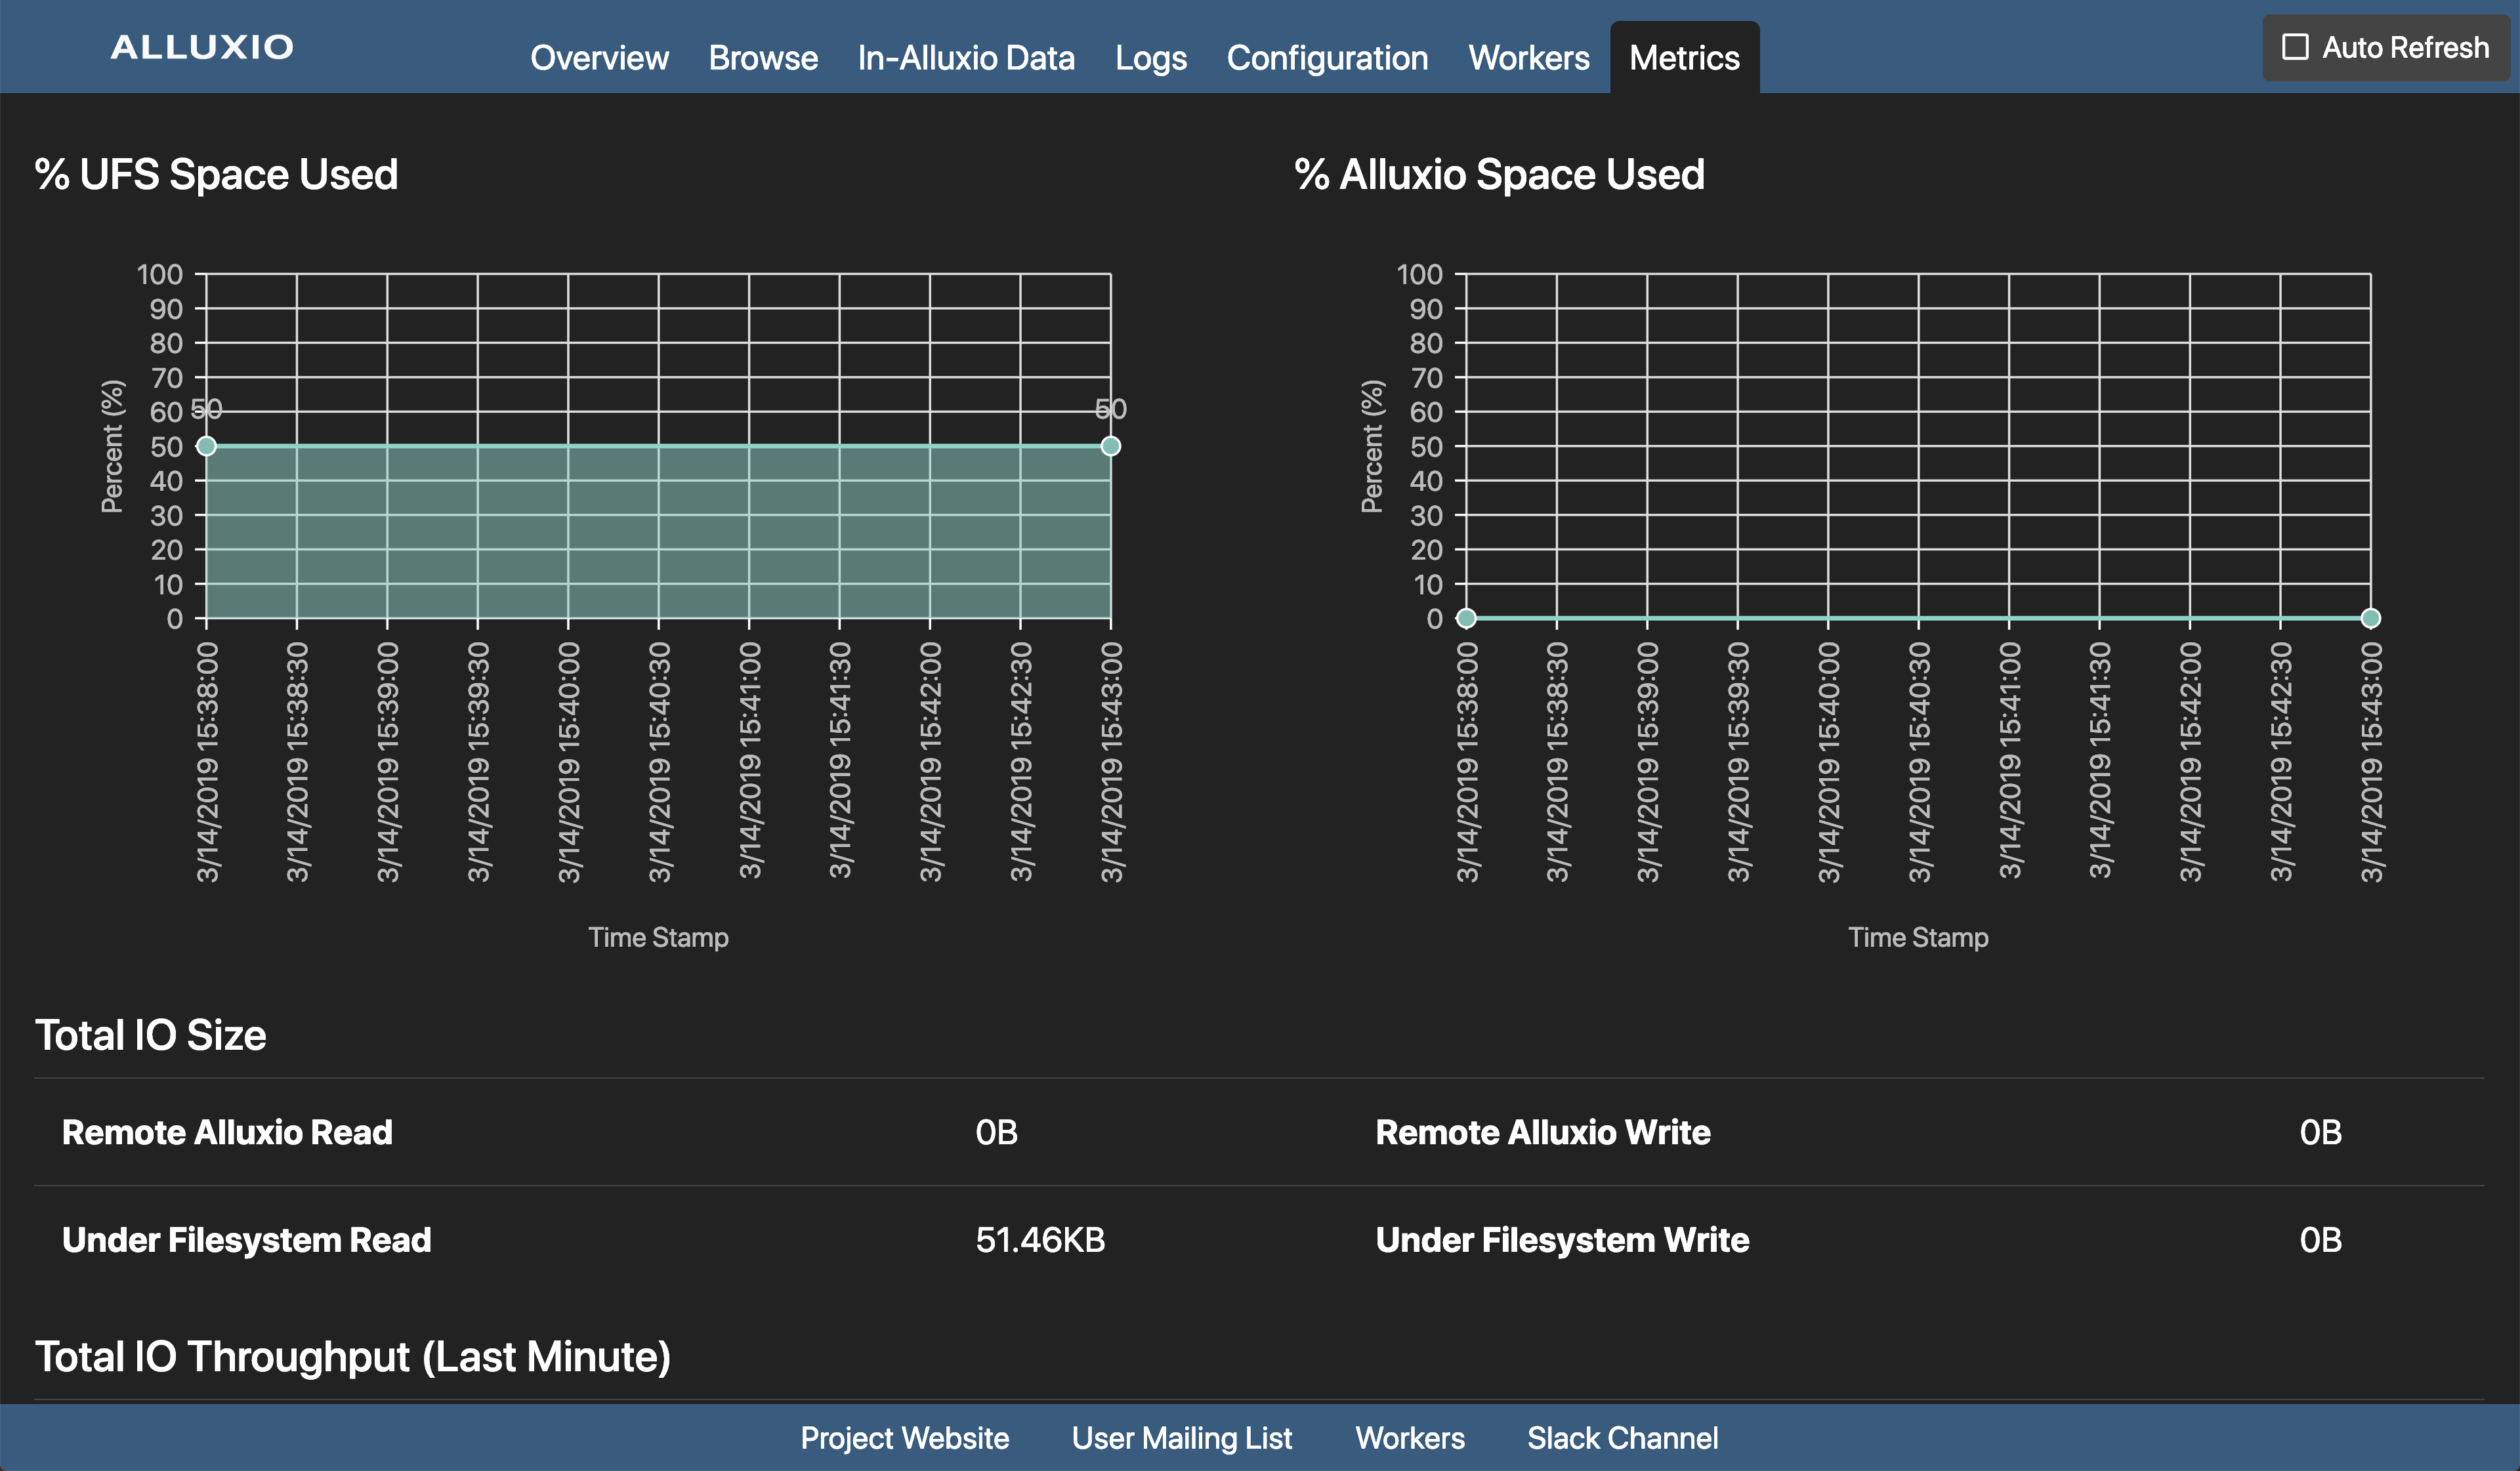
This section shows all master metrics. It includes the following sections:
-
% UFS Space Used Overall measures of UFS capacity.
-
% Alluxio Space Used Overall measures of Alluxio capacity.
-
Logical Operation Number of operations performed.
-
RPC Invocation Number of RPC invocations per operation.
Alluxio Workers Web Interface
The web interface for an Alluxio worker can be found by visiting http://<WORKER IP>:30000.
For instance, if Alluxio was started locally, the worker web interface
can be viewed by visiting localhost:30000.
Home Page
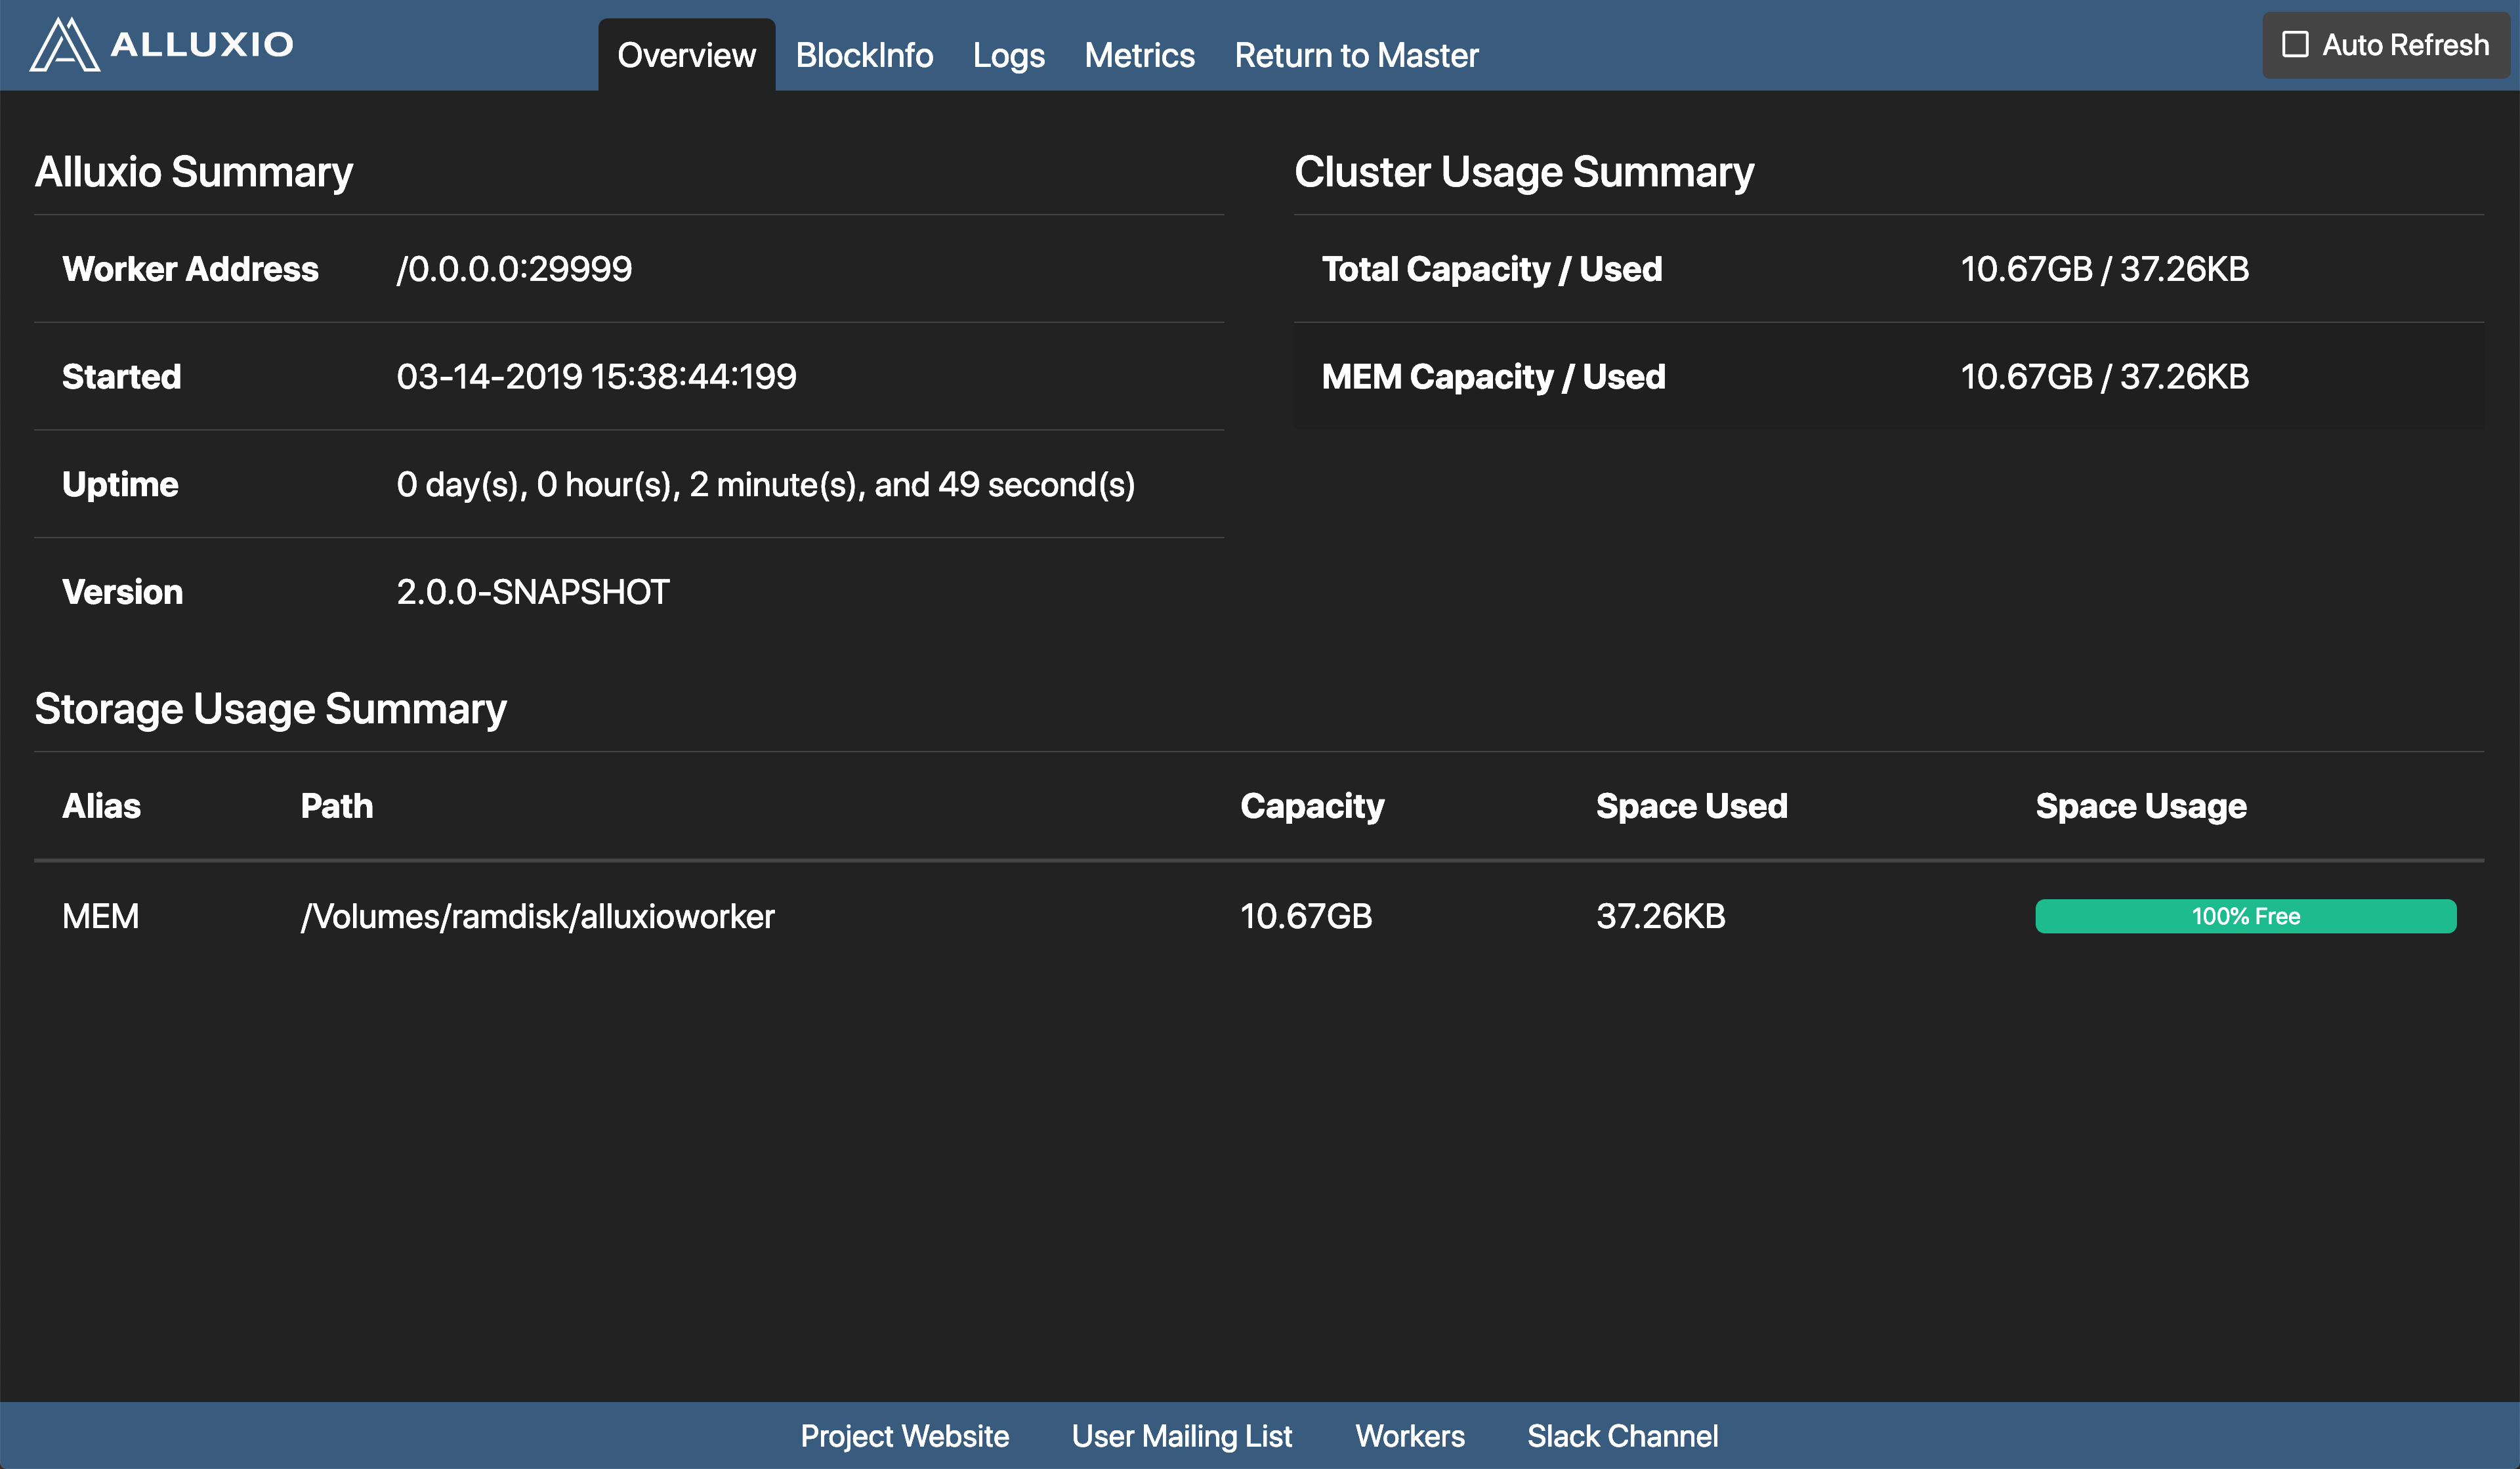
The home page for the Alluxio worker web interface is similar to the home page for the Alluxio master, but shows information specific to the particular worker.
BlockInfo Page
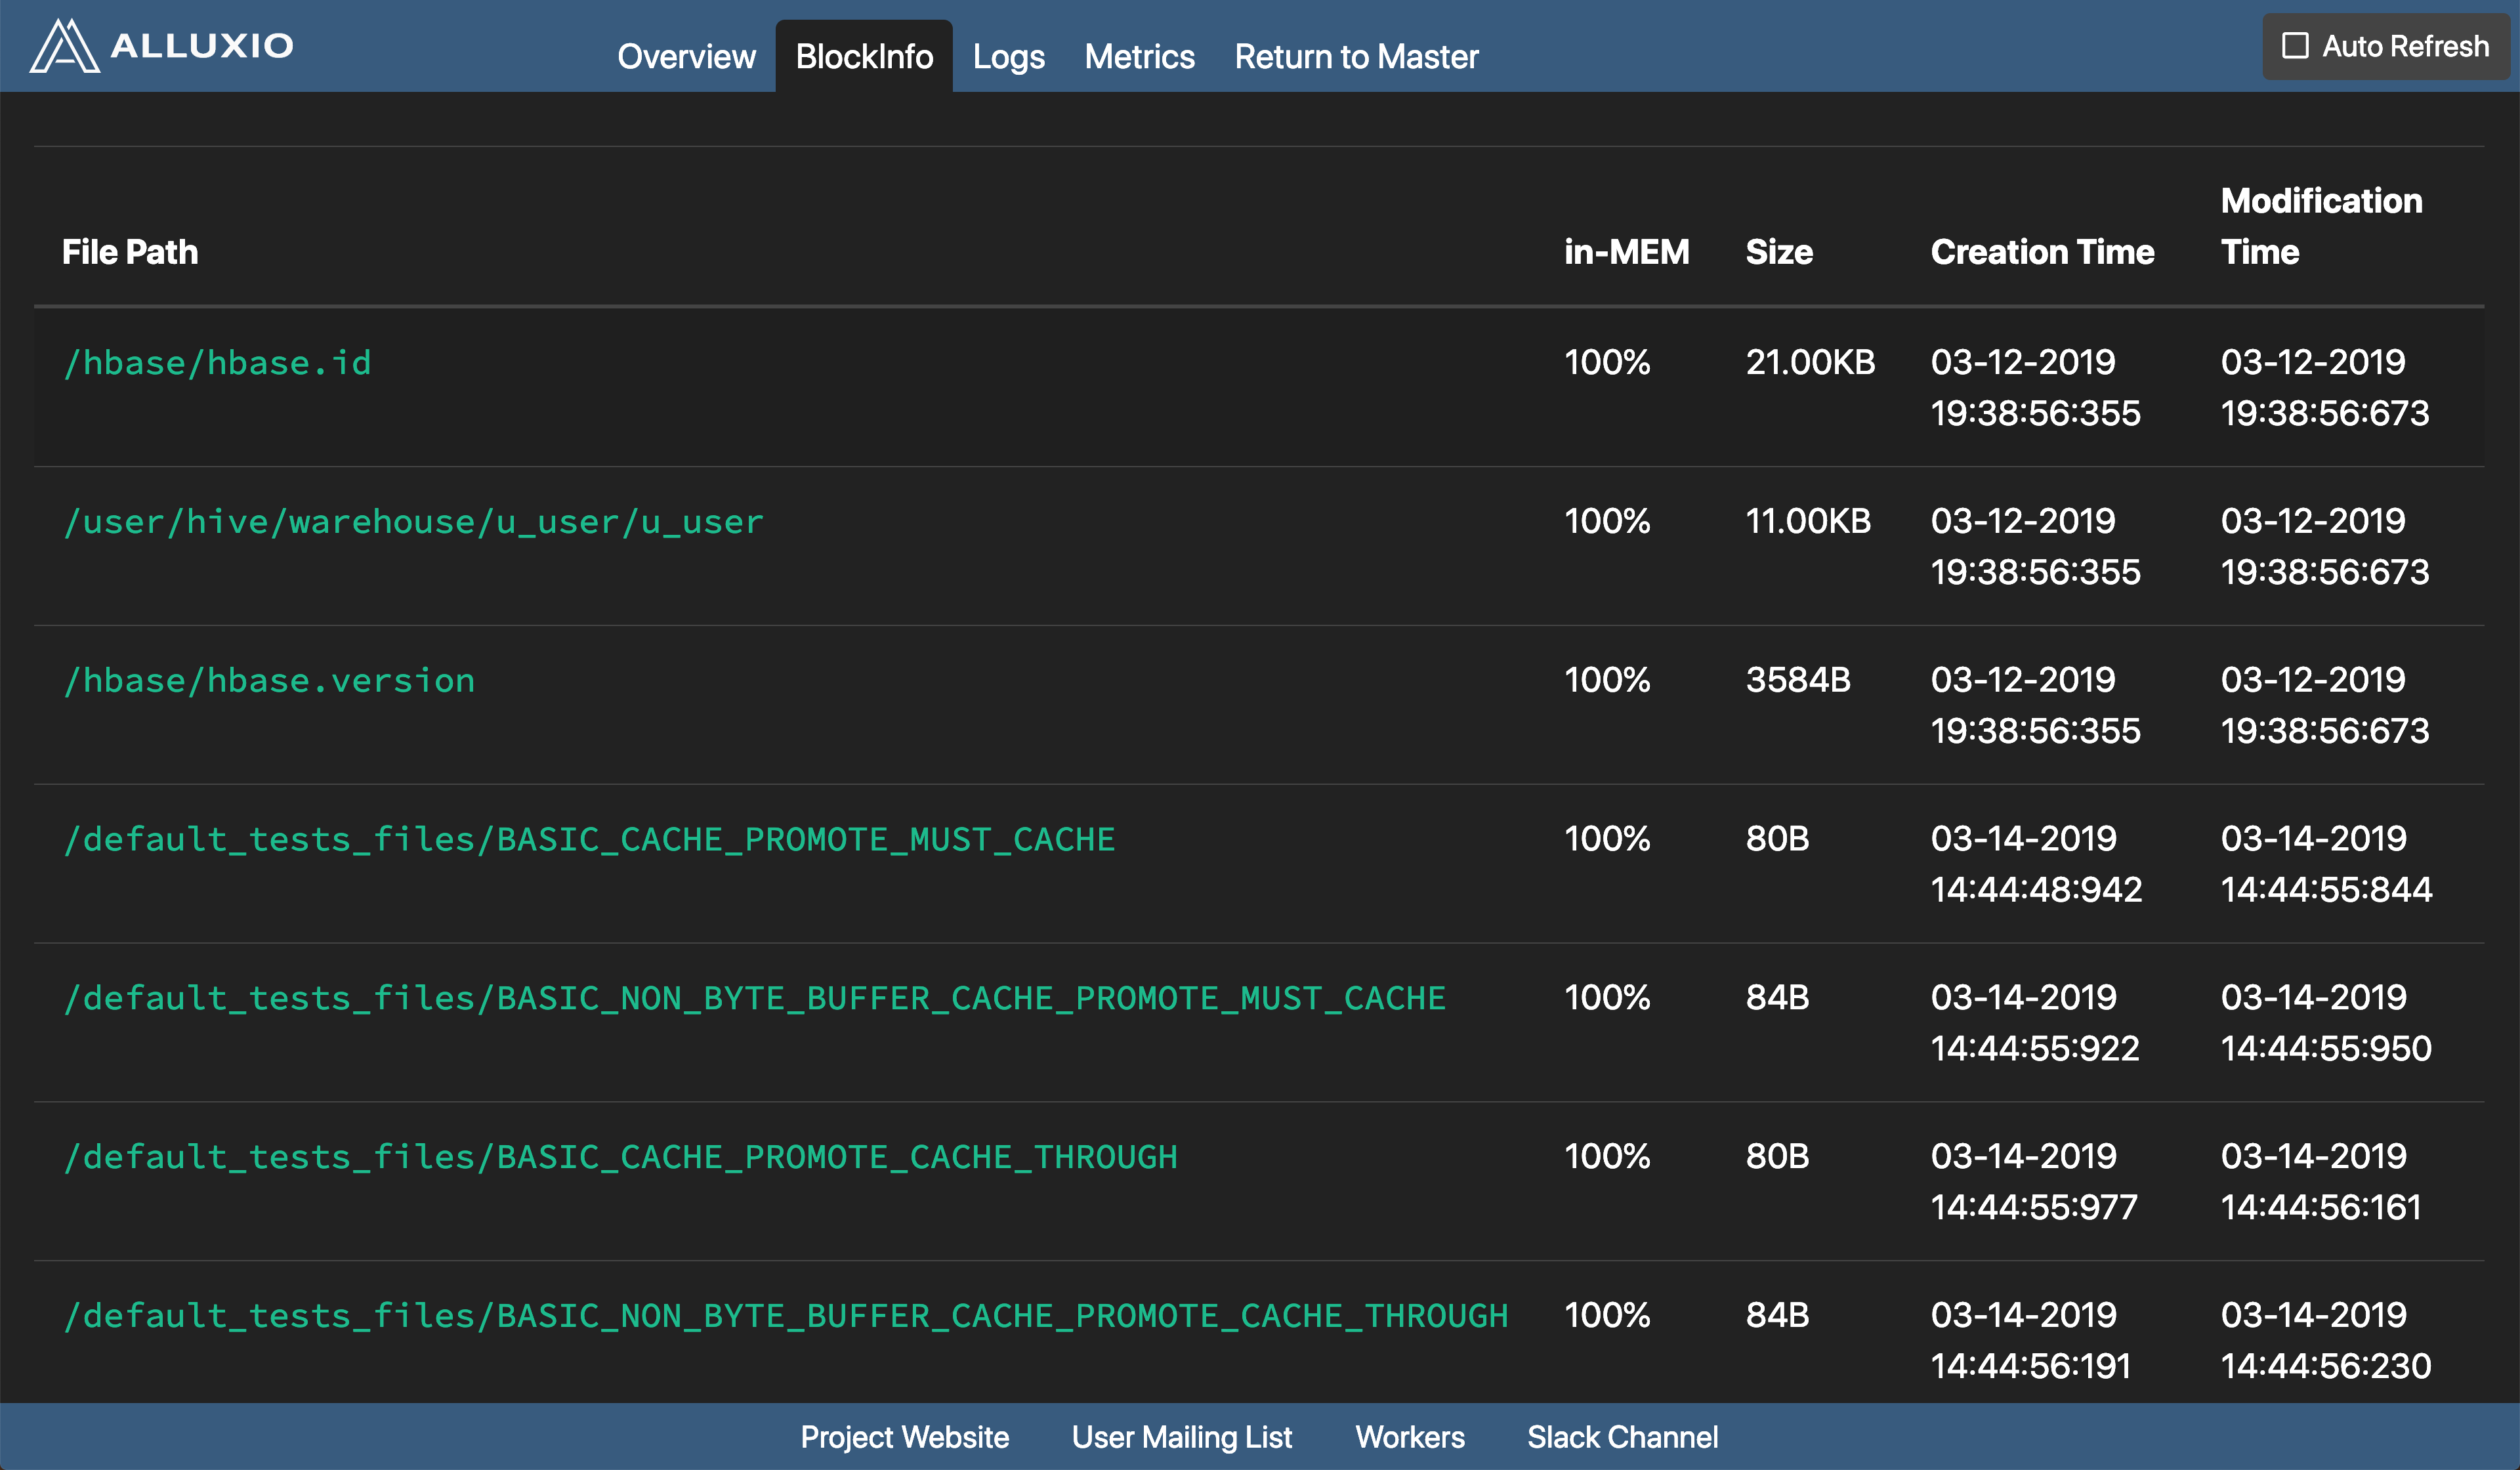
In the “BlockInfo” page, information on the files stored by the worker is shown, such as the file size and which tier the file is stored on. Clicking on a file shows the blocks of that file.
Worker Metrics
To Access worker metrics section, click on the “Metrics” tab in the navigation bar.
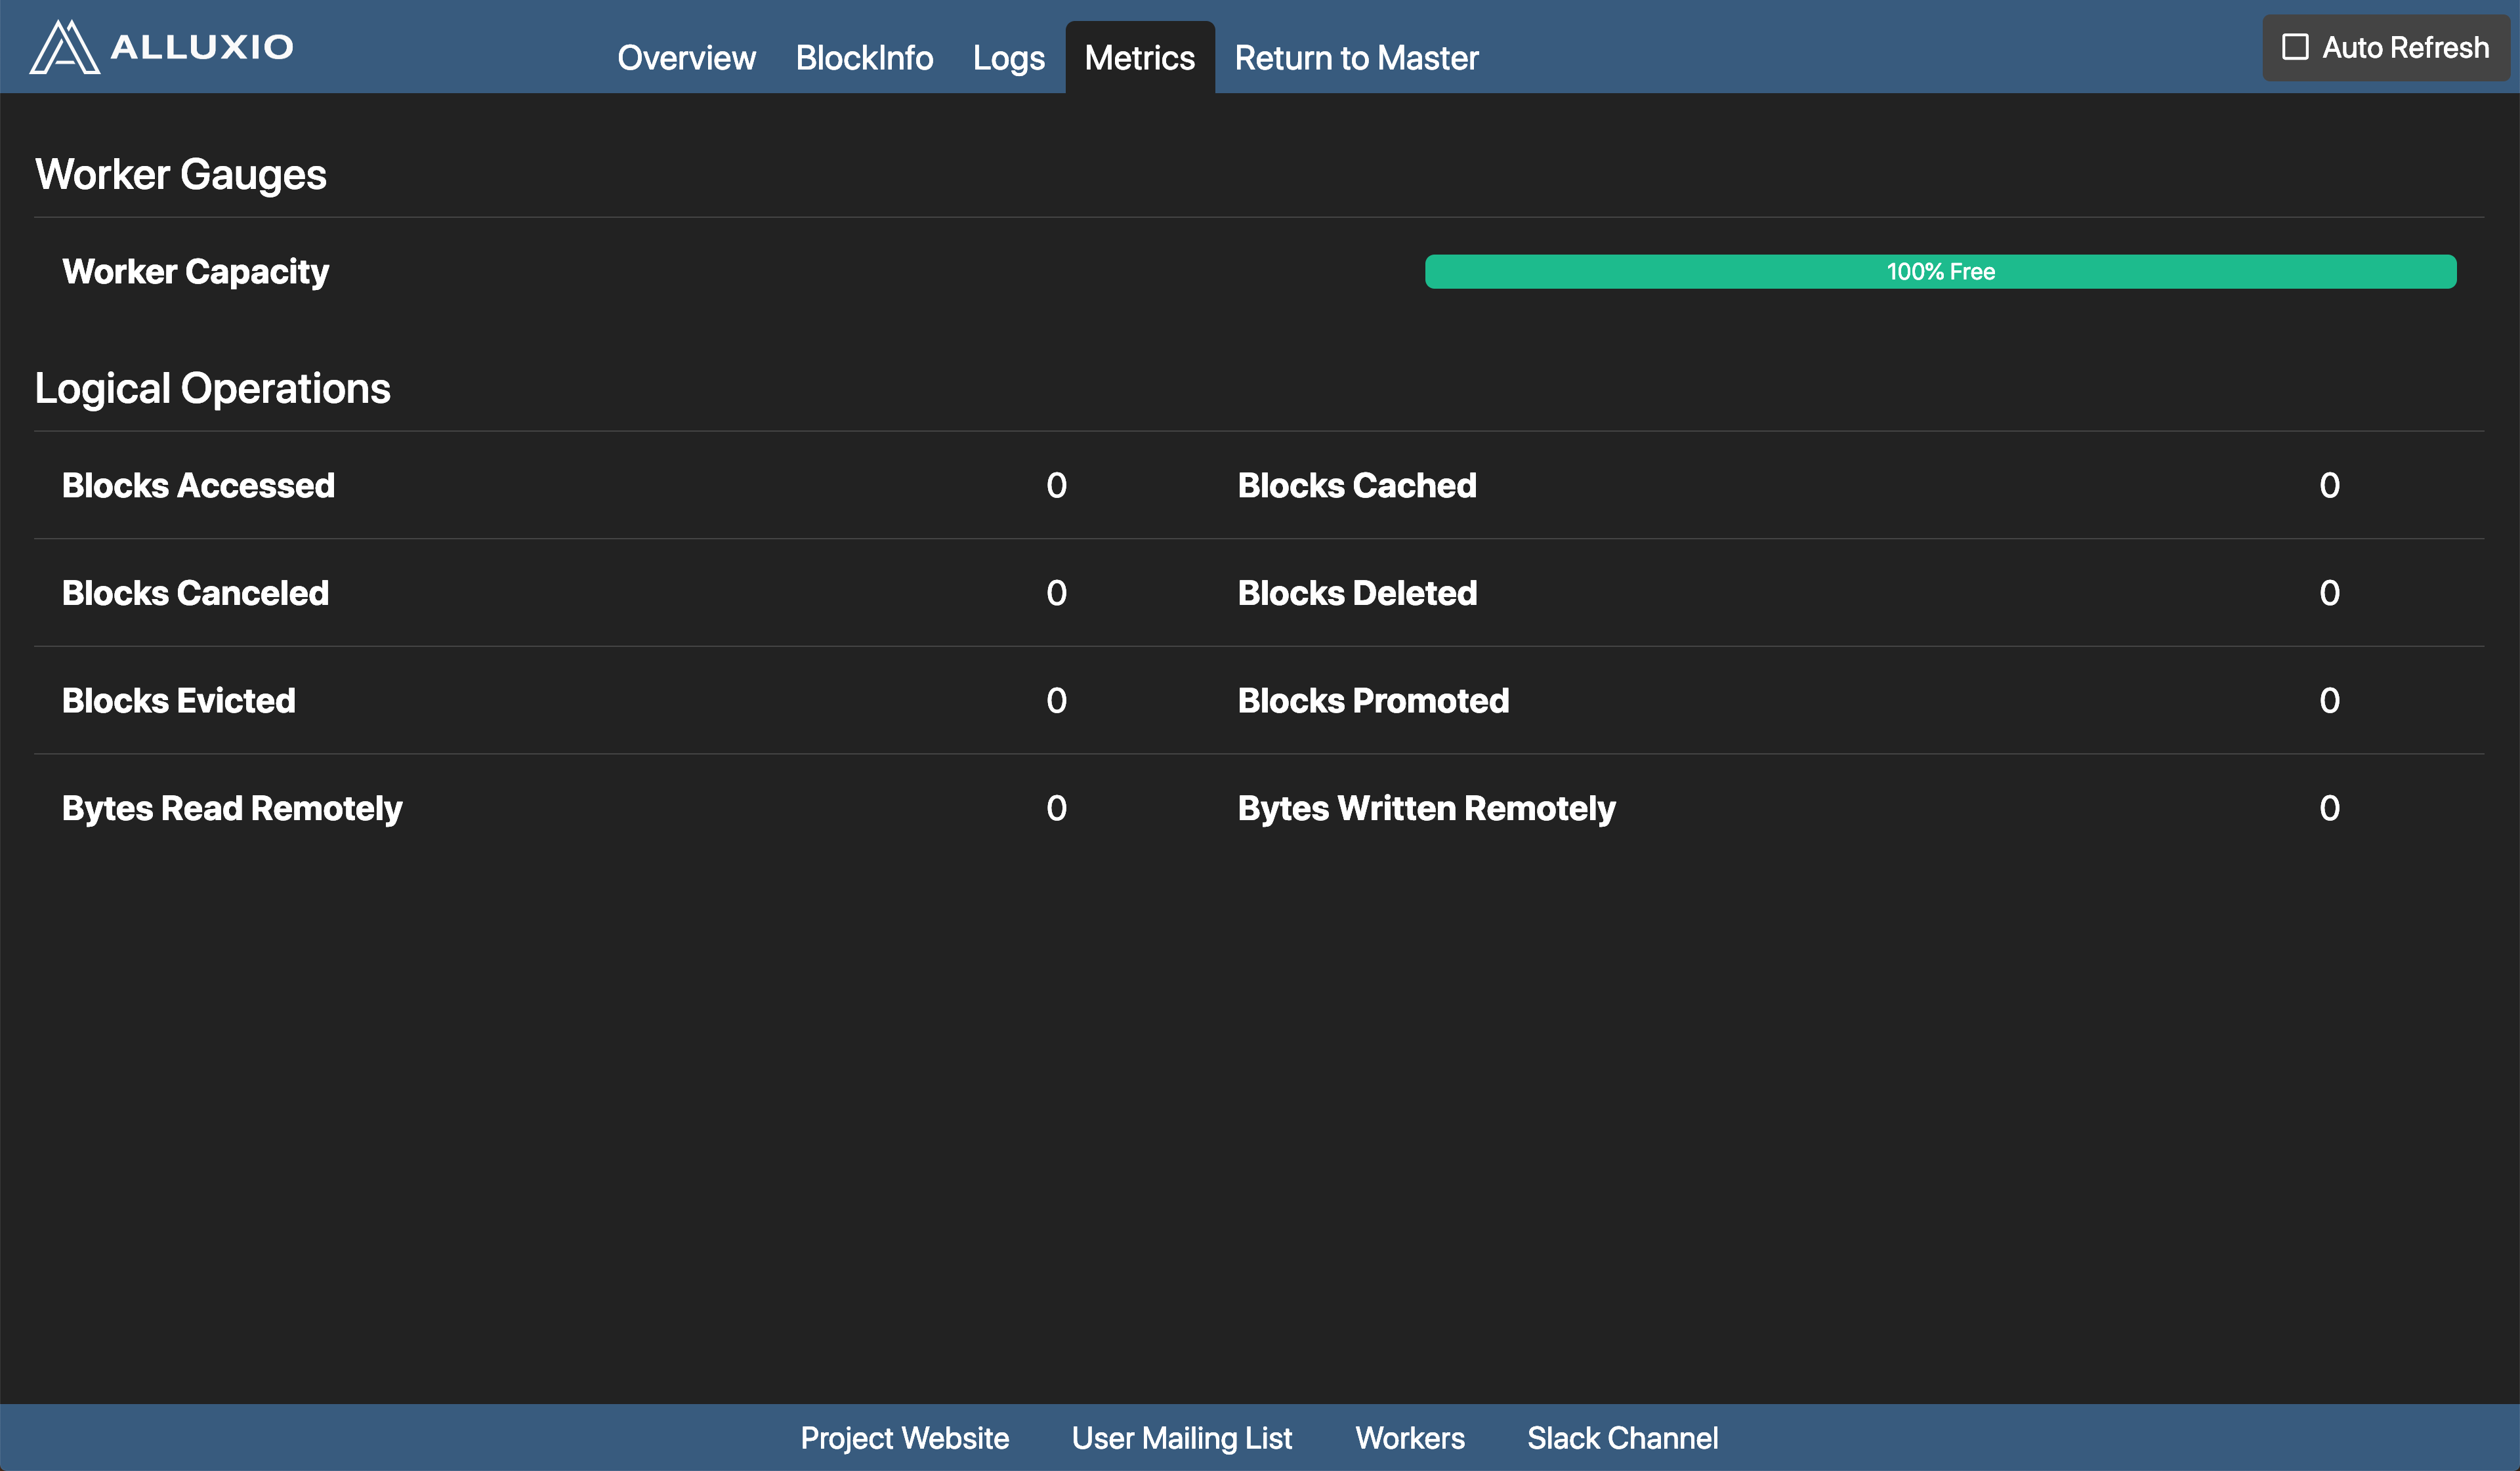
This section shows all worker metrics. It includes the following sections:
-
Worker Gauges Overall measures of the worker.
-
Logical Operations Number of operations performed.


