
Introduction
![]()

![]()
What is Alluxio
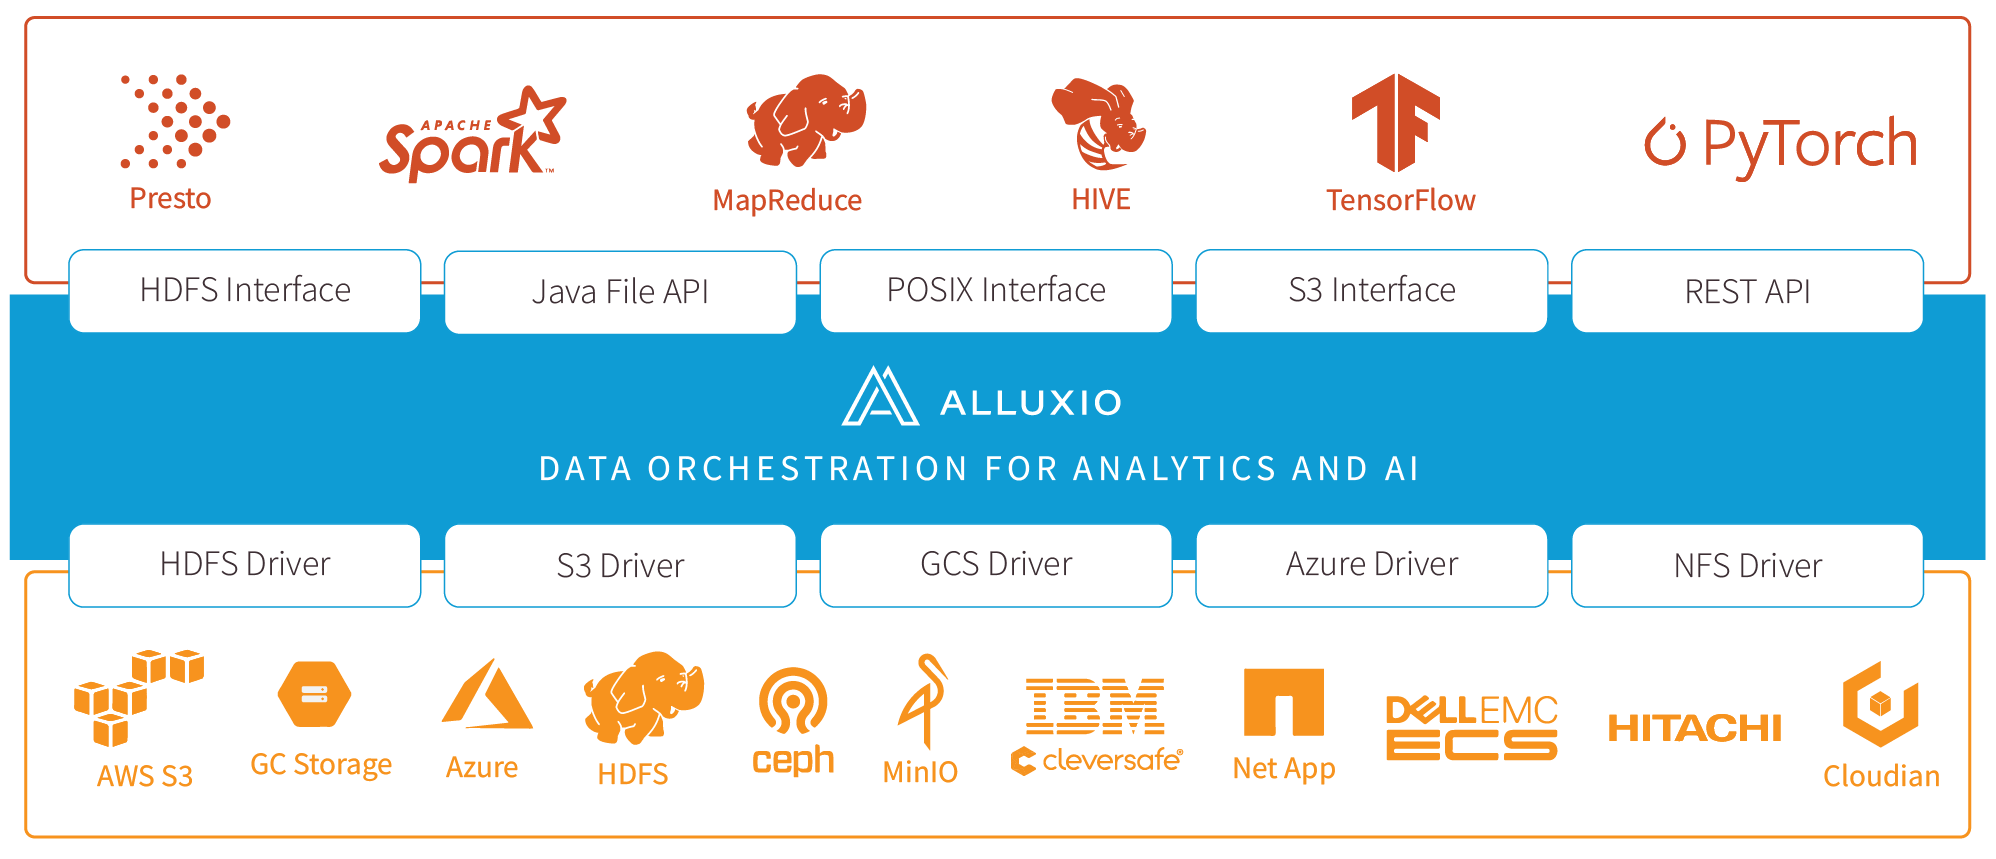
Alluxio is world’s first open source data orchestration technology for analytics and AI for the cloud. It bridges the gap between data driven applications and storage systems, bringing data from the storage tier closer to the data driven applications and makes it easily accessible enabling applications to connect to numerous storage systems through a common interface. Alluxio’s memory-first tiered architecture enables data access at speeds orders of magnitude faster than existing solutions.
In the data ecosystem, Alluxio lies between data driven applications, such as Apache Spark, Presto, Tensorflow, Apache HBase, Apache Hive, or Apache Flink, and various persistent storage systems, such as Amazon S3, Google Cloud Storage, OpenStack Swift, HDFS, IBM Cleversafe, EMC ECS, Ceph, NFS, Minio, and Alibaba OSS. Alluxio unifies the data stored in these different storage systems, presenting unified client APIs and a global namespace to its upper layer data driven applications.
The Alluxio project originated from the UC Berkeley AMPLab (see papers) as the data access layer of the Berkeley Data Analytics Stack (BDAS). It is open source under Apache License 2.0. Alluxio is one of the fastest growing open source projects that has attracted more than 1000 contributors from over 300 institutions including Alibaba, Alluxio, Baidu, CMU, Google, IBM, Intel, NJU, Red Hat, Tencent, UC Berkeley, and Yahoo.
Today, Alluxio is deployed in production by hundreds of organizations with the largest deployment exceeding 1,500 nodes.
Benefits
Alluxio helps overcome the obstacles in extracting insight from data by simplifying how applications access their data, regardless of format or location. The benefits of Alluxio include:
-
Memory-Speed I/O: Alluxio can be used as a distributed shared caching service so compute applications talking to Alluxio can transparently cache frequently accessed data, especially from remote locations, to provide in-memory I/O throughput. In addition, Alluxio’s tiered storage which can leverage both memory and disk (SSD/HDD) makes elastically scaling data-driven applications cost effective.
-
Simplified Cloud and Object Storage Adoption: Cloud and object storage systems use different semantics that have performance implications compared to traditional file systems. Common file system operations such as directory listing and renaming often incur significant performance overhead. When accessing data in cloud storage, applications have no node-level locality or cross-application caching. Deploying Alluxio with cloud or object storage mitigates these problems by serving data from Alluxio instead of the underlying cloud or object storage.
-
Simplified Data Management: Alluxio provides a single point of access to multiple data sources. In addition to connecting data sources of different types, Alluxio also enables users to simultaneously connect to different versions of the same storage system, such as multiple versions of HDFS, without complex system configuration and management.
-
Easy Application Deployment: Alluxio manages communication between applications and file or object storages, translating data access requests from applications into underlying storage interfaces. Alluxio is Hadoop compatible. Existing data analytics applications, such as Spark and MapReduce programs, can run on top of Alluxio without any code changes.
Technical Innovations
Alluxio brings three key areas of innovation together to provide a unique set of capabilities.
-
Global Namespace: Alluxio serves as a single point of access to multiple independent storage systems regardless of physical location. This provides a unified view of all data sources and a standard interface for applications. See Namespace Management for more details.
-
Intelligent Multi-tiering Caching: Alluxio clusters act as a read and write cache for data in connected storage systems. Configurable policies automatically optimize data placement for performance and reliability across both memory and disk (SSD/HDD). Caching is transparent to the user and uses buffering to maintain consistency with persistent storage. See Alluxio Storage Management for more details.
-
Server-Side API Translation: Alluxio supports industry common APIs, such as HDFS API, S3 API, FUSE API, REST API. It transparently converts from a standard client-side interface to any storage interface. Alluxio manages communication between applications and file or object storage, eliminating the need for complex system configuration and management. File data can look like object data and vice versa.
To understand more details on Alluxio internals, please read Alluxio architecture and data flow.
Getting Started
To quickly get Alluxio up and running, take a look at our Getting Started page, which explains how to deploy Alluxio and run examples in a local environment.
Also try our getting started tutorial for Presto & Alluxio via:

Downloads and Useful Resources
Released versions of Alluxio are available from the Project Downloads Page. Each release comes with prebuilt binaries compatible with various Hadoop versions. Building From Master Branch Documentation explains how to build the project from source code. Questions can be directed to our User Mailing List or our Community Slack Channel.
Downloads | User Guide | Developer Guide | Meetup Group | Issue Tracking | Community Slack Channel | User Mailing List | Videos | Github | Releases